This week, I’ve been working on trying to solve my problem of displaying demographic info geographically, when the geographic information isn’t precise. I still haven’t solved that problem, but I’ve played around with different methods of presentation. I’ve also started to recreate a map that I would like to use in my project with Illustrator.
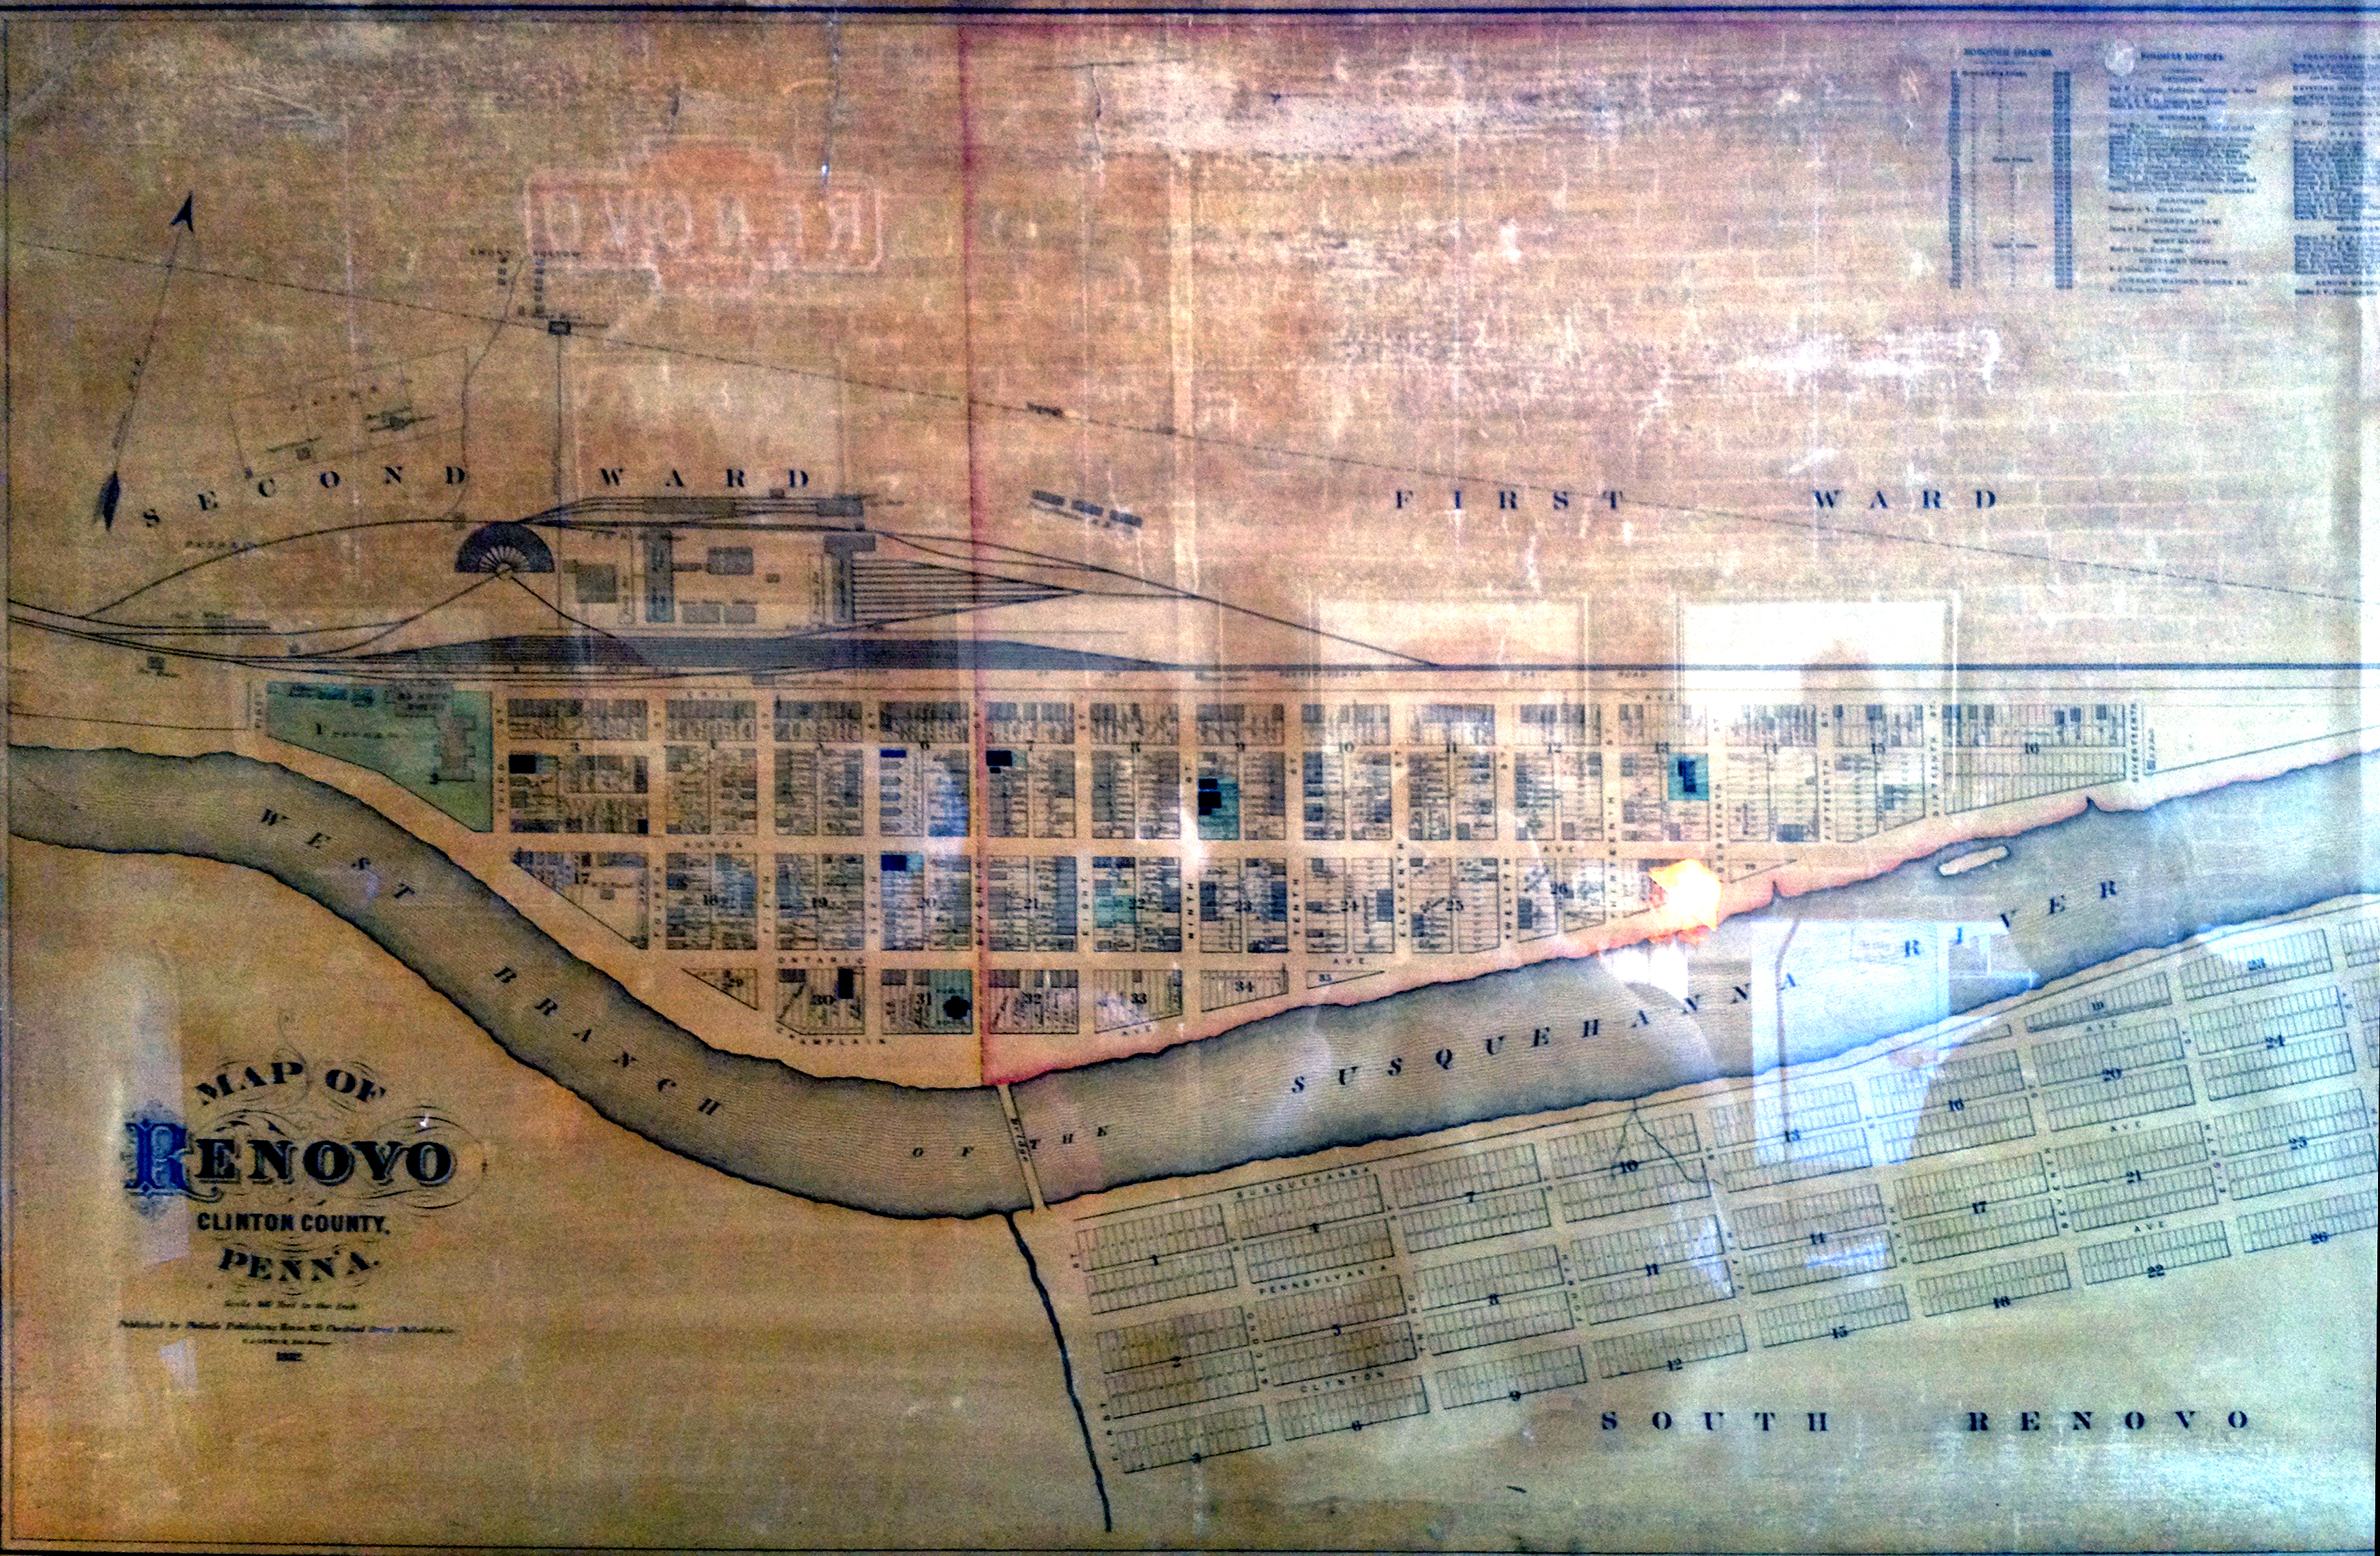
When I visited Renovo in October, I took a photo of a map from 1882 that was framed behind glass on a wall inside the Greater Renovo Area Heritage Park Association’s headquarters. That picture, as you can see below, wasn’t that great, no matter how much Photoshopping I tried.
I decided to throw it into Illustrator and start tracing the outlines of the blocks and rail yard, and came up with this image (still unfinished):
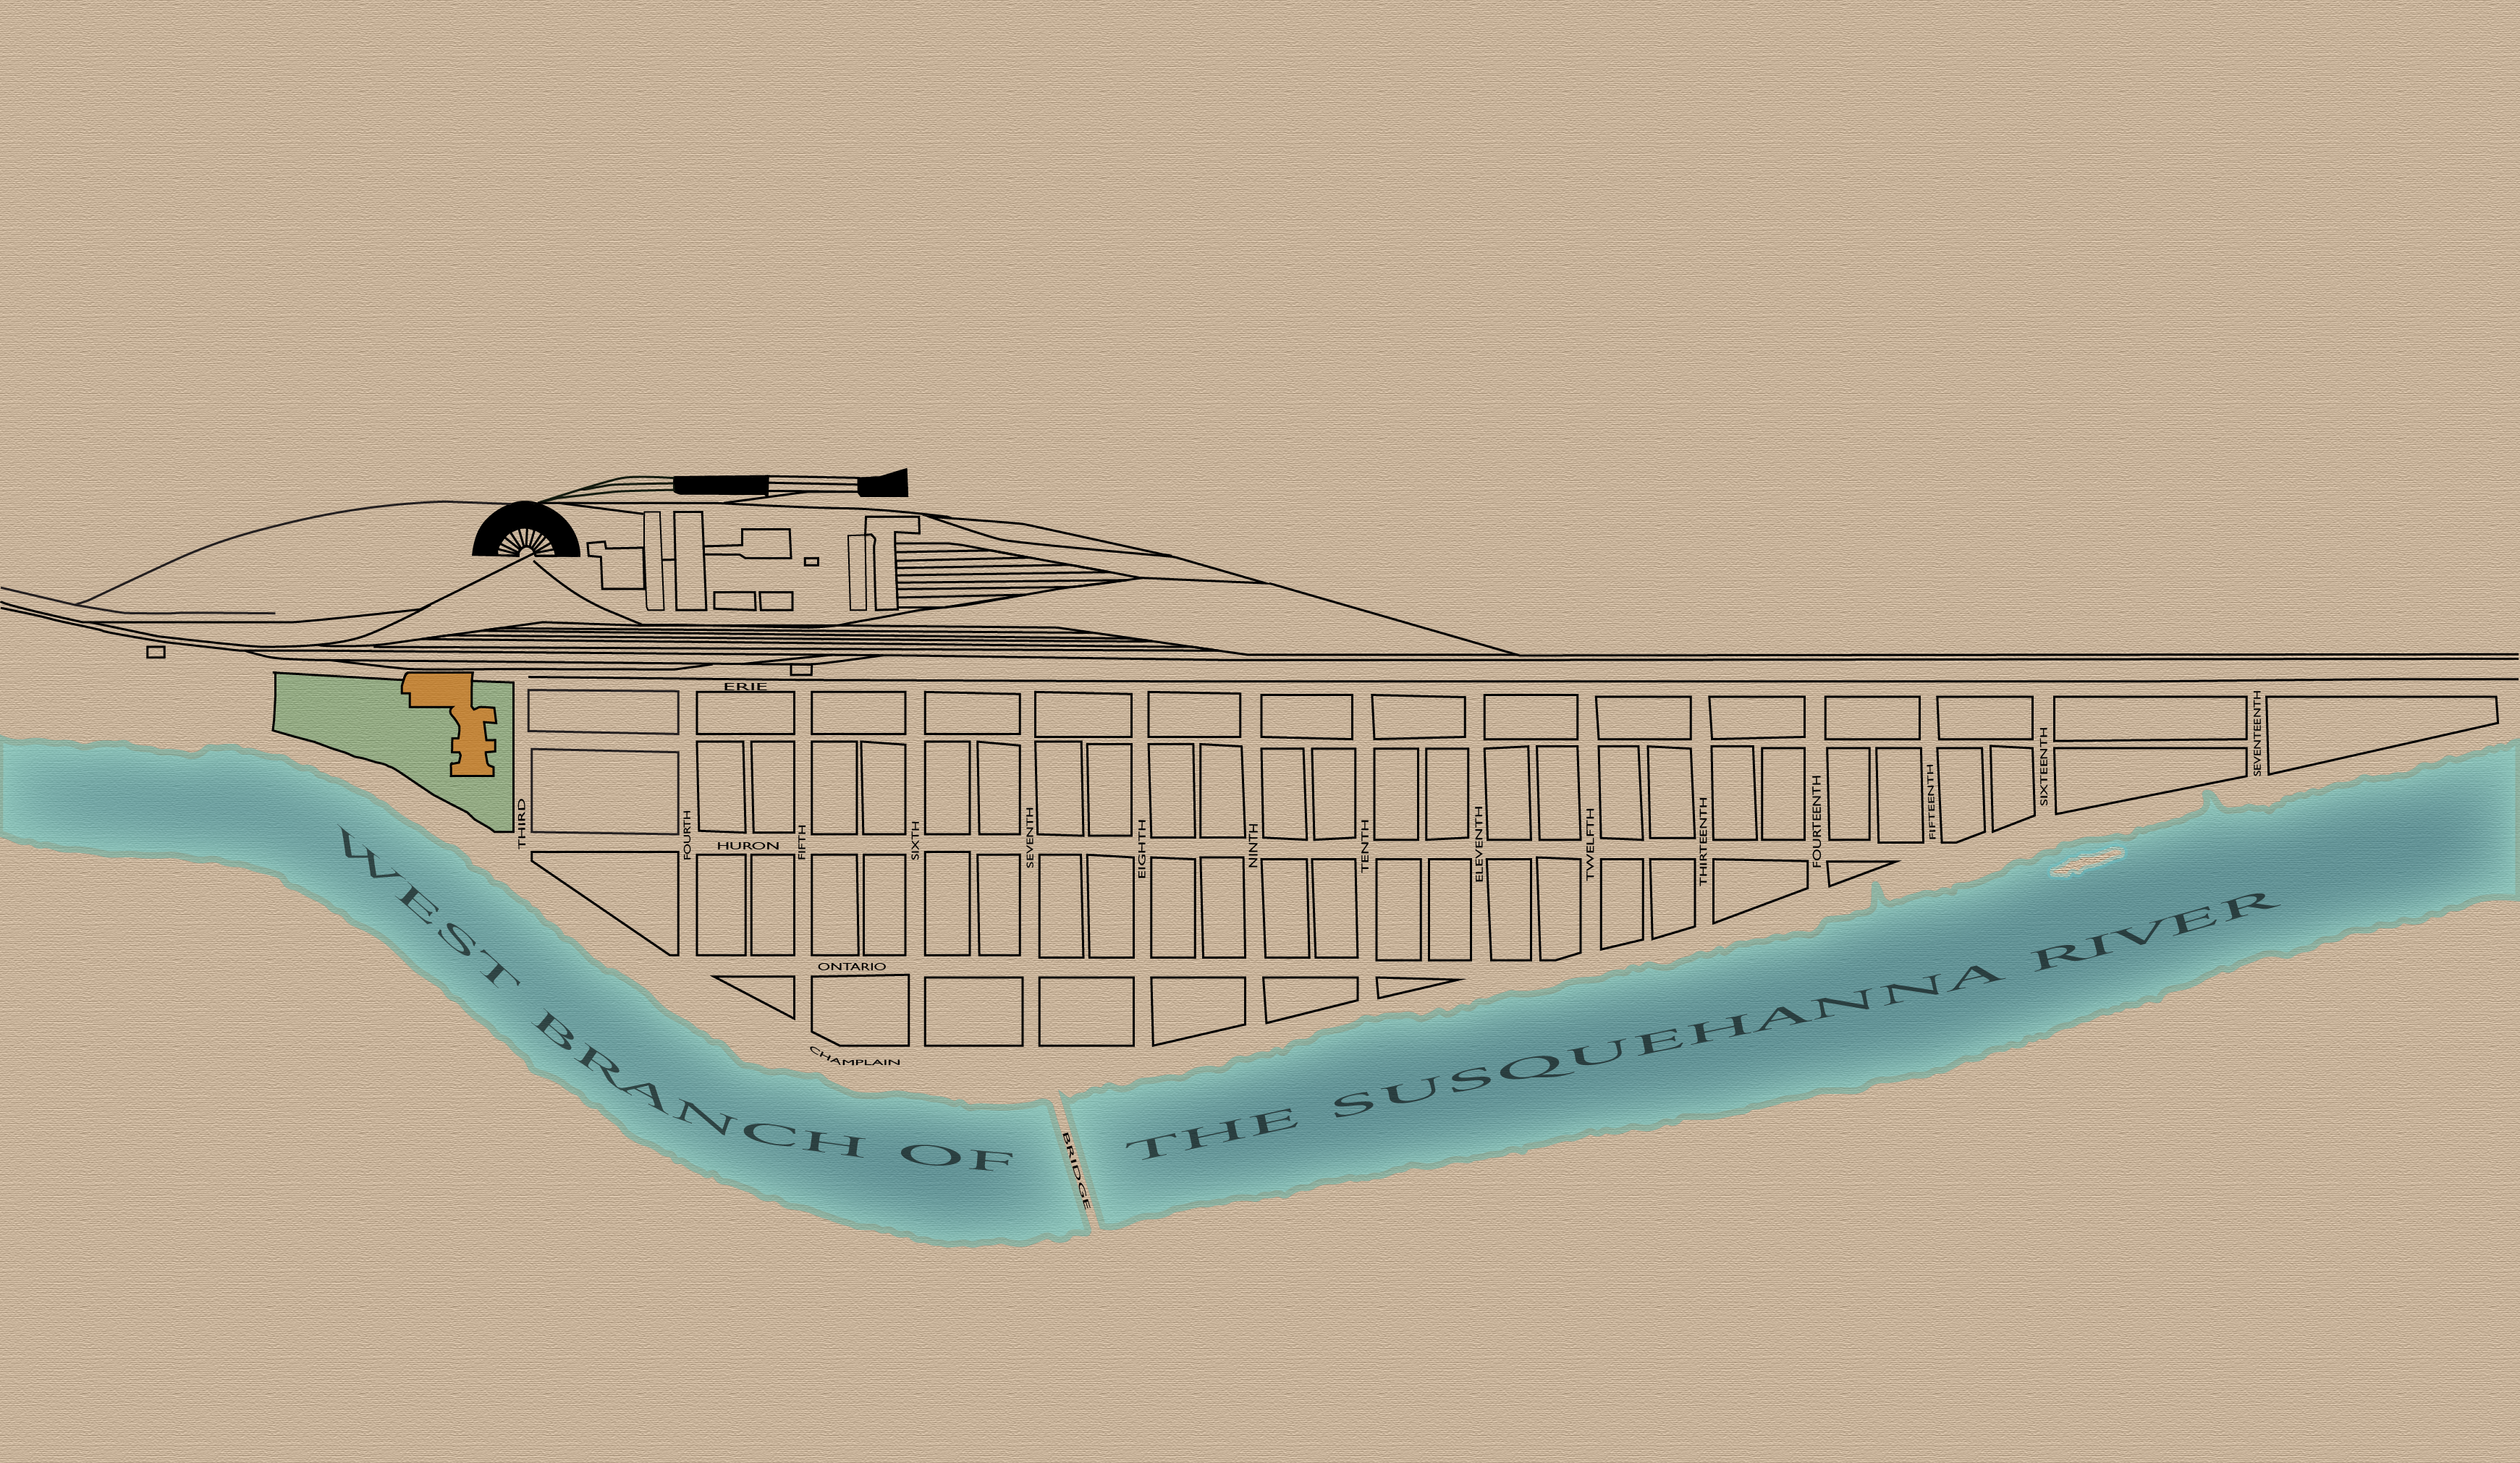
I colored in the river and applied the inner glow filter to it, as well as placed the tracing on top of a texturized beige background. I tried to replicate the lettering of the streets to match the original, but I might need to go back and touch those up, especially the text on the river. I colored in the grassy lot and combination passenger station and hotel in the upper left corner, just to see how it would look. I’m not quite sure what to do with the rest of the blocks yet, as the detail from the original map is difficult to interpret. I think this version looks much more clean and legible than the original, and I hope I will be able to used this in my final project somehow, even if just to provide an overview of the layout of the town. I also didn’t include South Renovo, as the lots on the original were just placeholders for future development. I may use that space to include a legend of the map.
The other aspect of my project that I’m still wrestling with is the geographic presentation of immigrant distribution throughout the town. While I have house-level detail of address for the 1910 census, the 1880 census only gives me basic information, such as whether they lived in the East or West Wards of the town. In the 1880 census, the wards were divided at 7th Street, so at least I have that information to work with. Since I have entered all the immigrants’ current locations based off the census into a spreadsheet, I tried putting that data into one of the tools I learned about last year in Clio 1. The tool is called RAW, and can help display data tables visually. Since I only had tables of addresses that only contained “East Ward” or “West Ward” and place of birth with countries’ names, I didn’t have any numbers to work with. This limited my options a bit, but I was able to create two different charts to display the demographic distribution.
This first one is an Alluvial Diagram that connects current location with place of birth:

I can’t figure out why Canada and Germany are listed twice, however, which throws off this whole chart. I’ve checked for typos and weird spacings and haven’t found the culprit, so I’ll have to investigate further if I decide to use this in my final project.
This second map uses clusters to illustrate the breakdown of home countries by ward. Canada and Germany were still listed twice, but I was at least able to alter their color codings to have them match up. I still don’t know why it’s doing that, but at least this map is colorful! I’m assuming the larger cluster is the East Ward because that had a larger number of immigrants (and was bigger geographically), but the cluster map doesn’t label it. I Photoshopped in the legend because without it, this just looks like a bunch of pretty dots.
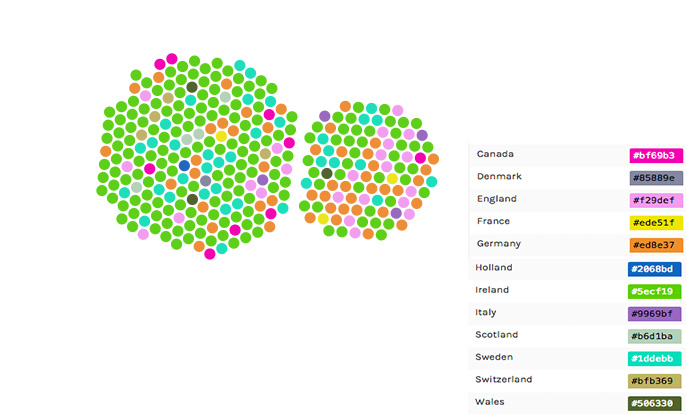
Both of these maps were created for web display, but RAW allows users to download both the .svg and .png formats in addition to the code to embed on a website. I’m not sure how helpful either of these maps are, but they do illustrate that there was a majority of Irish immigrants in Renovo during the 1880 census, and they resided in the East Ward. The German immigrants were heavily distributed in the West Ward and numbered a little less than the Irish. Even if I don’t use either of these maps in my final project, I think they have given me alternative ideas to display the limited geographic information that I have for the 1880 census.
All I can say is: Wow!
The graphs and maps look great!