Over the weekend, I had a wonderful idea about my final project! But then I hit a wall. I was going to look at the 1910 census records for all three of Renovo’s districts (East, Middle, & West Wards), extract the locations of all of the immigrant workers in the town, then plot those locations on the 1911 Sanborn map to visualize any patterns that might have been occurring at the time. Sounds easy enough, right? Well after I printed all 100+ pages of census data (at least Renovo’s a small town!), I grabbed seven different colored highlighters to color code anyone who was listed as being born in a foreign country. This part was fun! I kept notes on where they worked and where they were born, and unsurprisingly, most immigrants worked for the railroad. In 1911, I counted a total of 185 immigrant workers in the town, with 143 of them working in some capacity for the railroad.
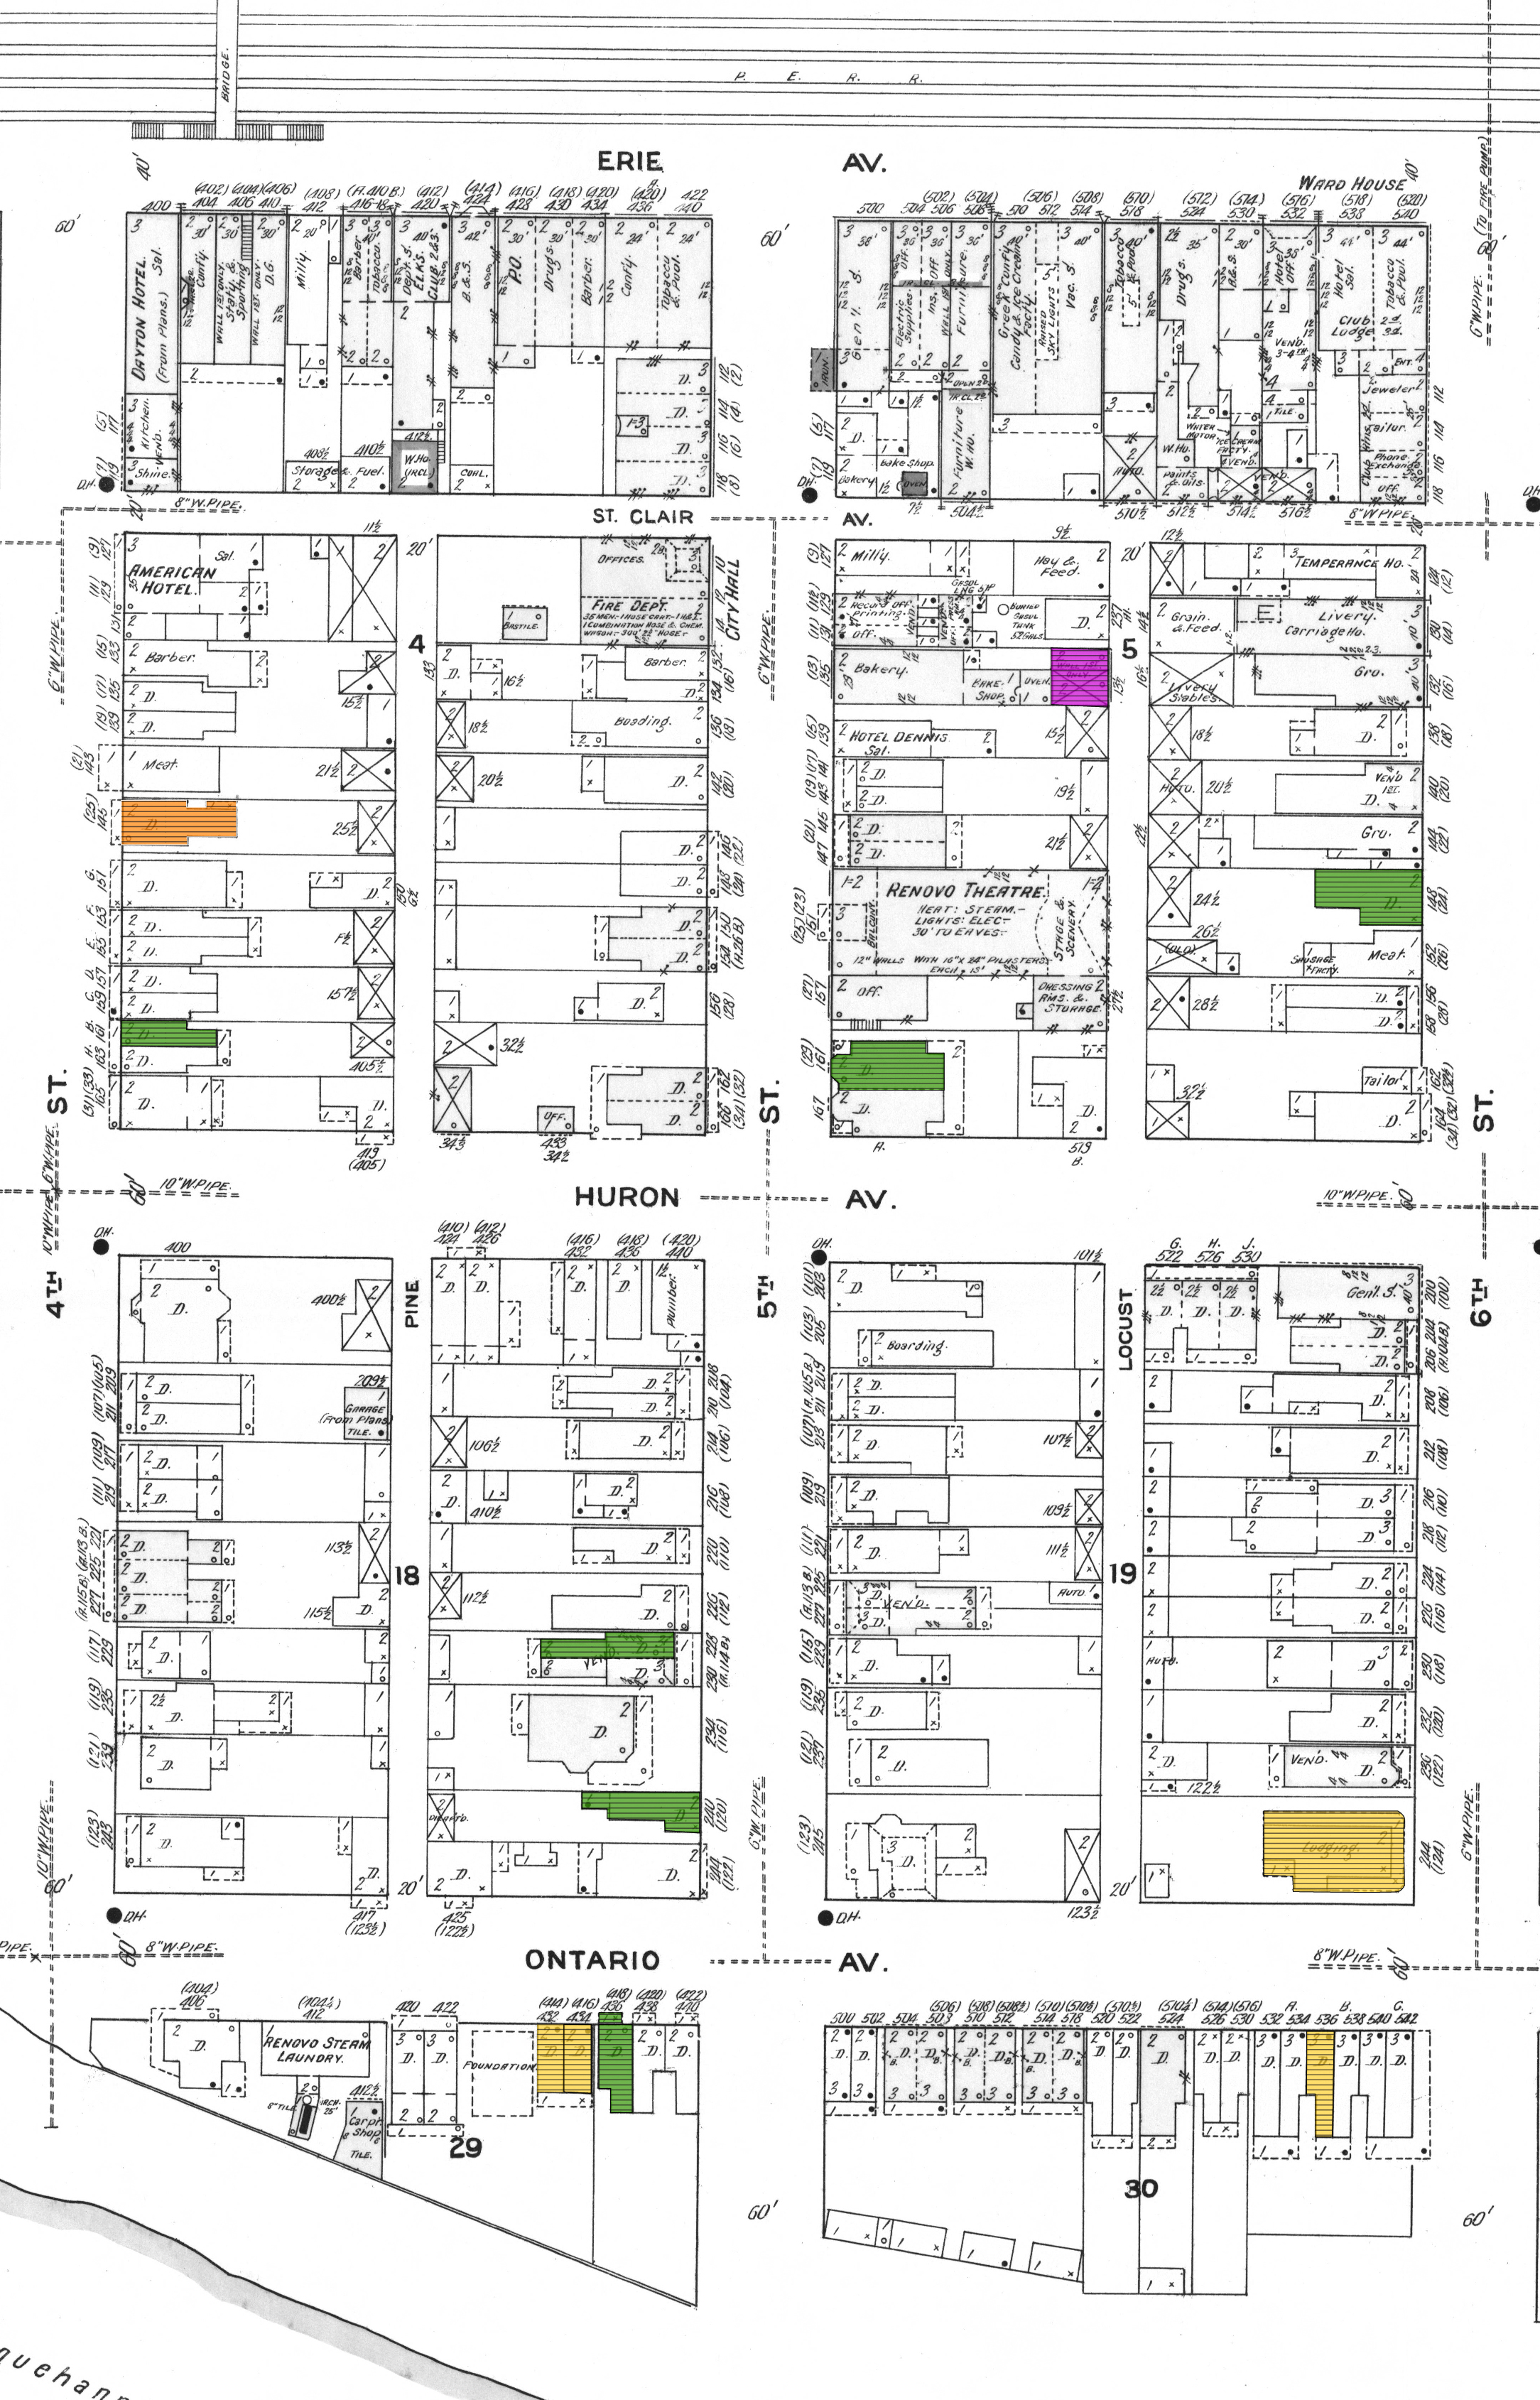
From there I went through the highlighted list of immigrant railroad workers and began plotting them on the 1911 map in Illustrator, trying to keep my color-coded system going. I used yellow for Swedish, orange for German, green for Irish, purple for Italian, dark blue for Hungarian-Slovakian, and light blue for Austrian-Slovenian, just to name the most frequent nationalities. Below you can see one section of the map that I am still working on, a part of the West Ward, 4th-6th Streets. I’ve only included railroad workers here, but plan on adding all immigrant workers.
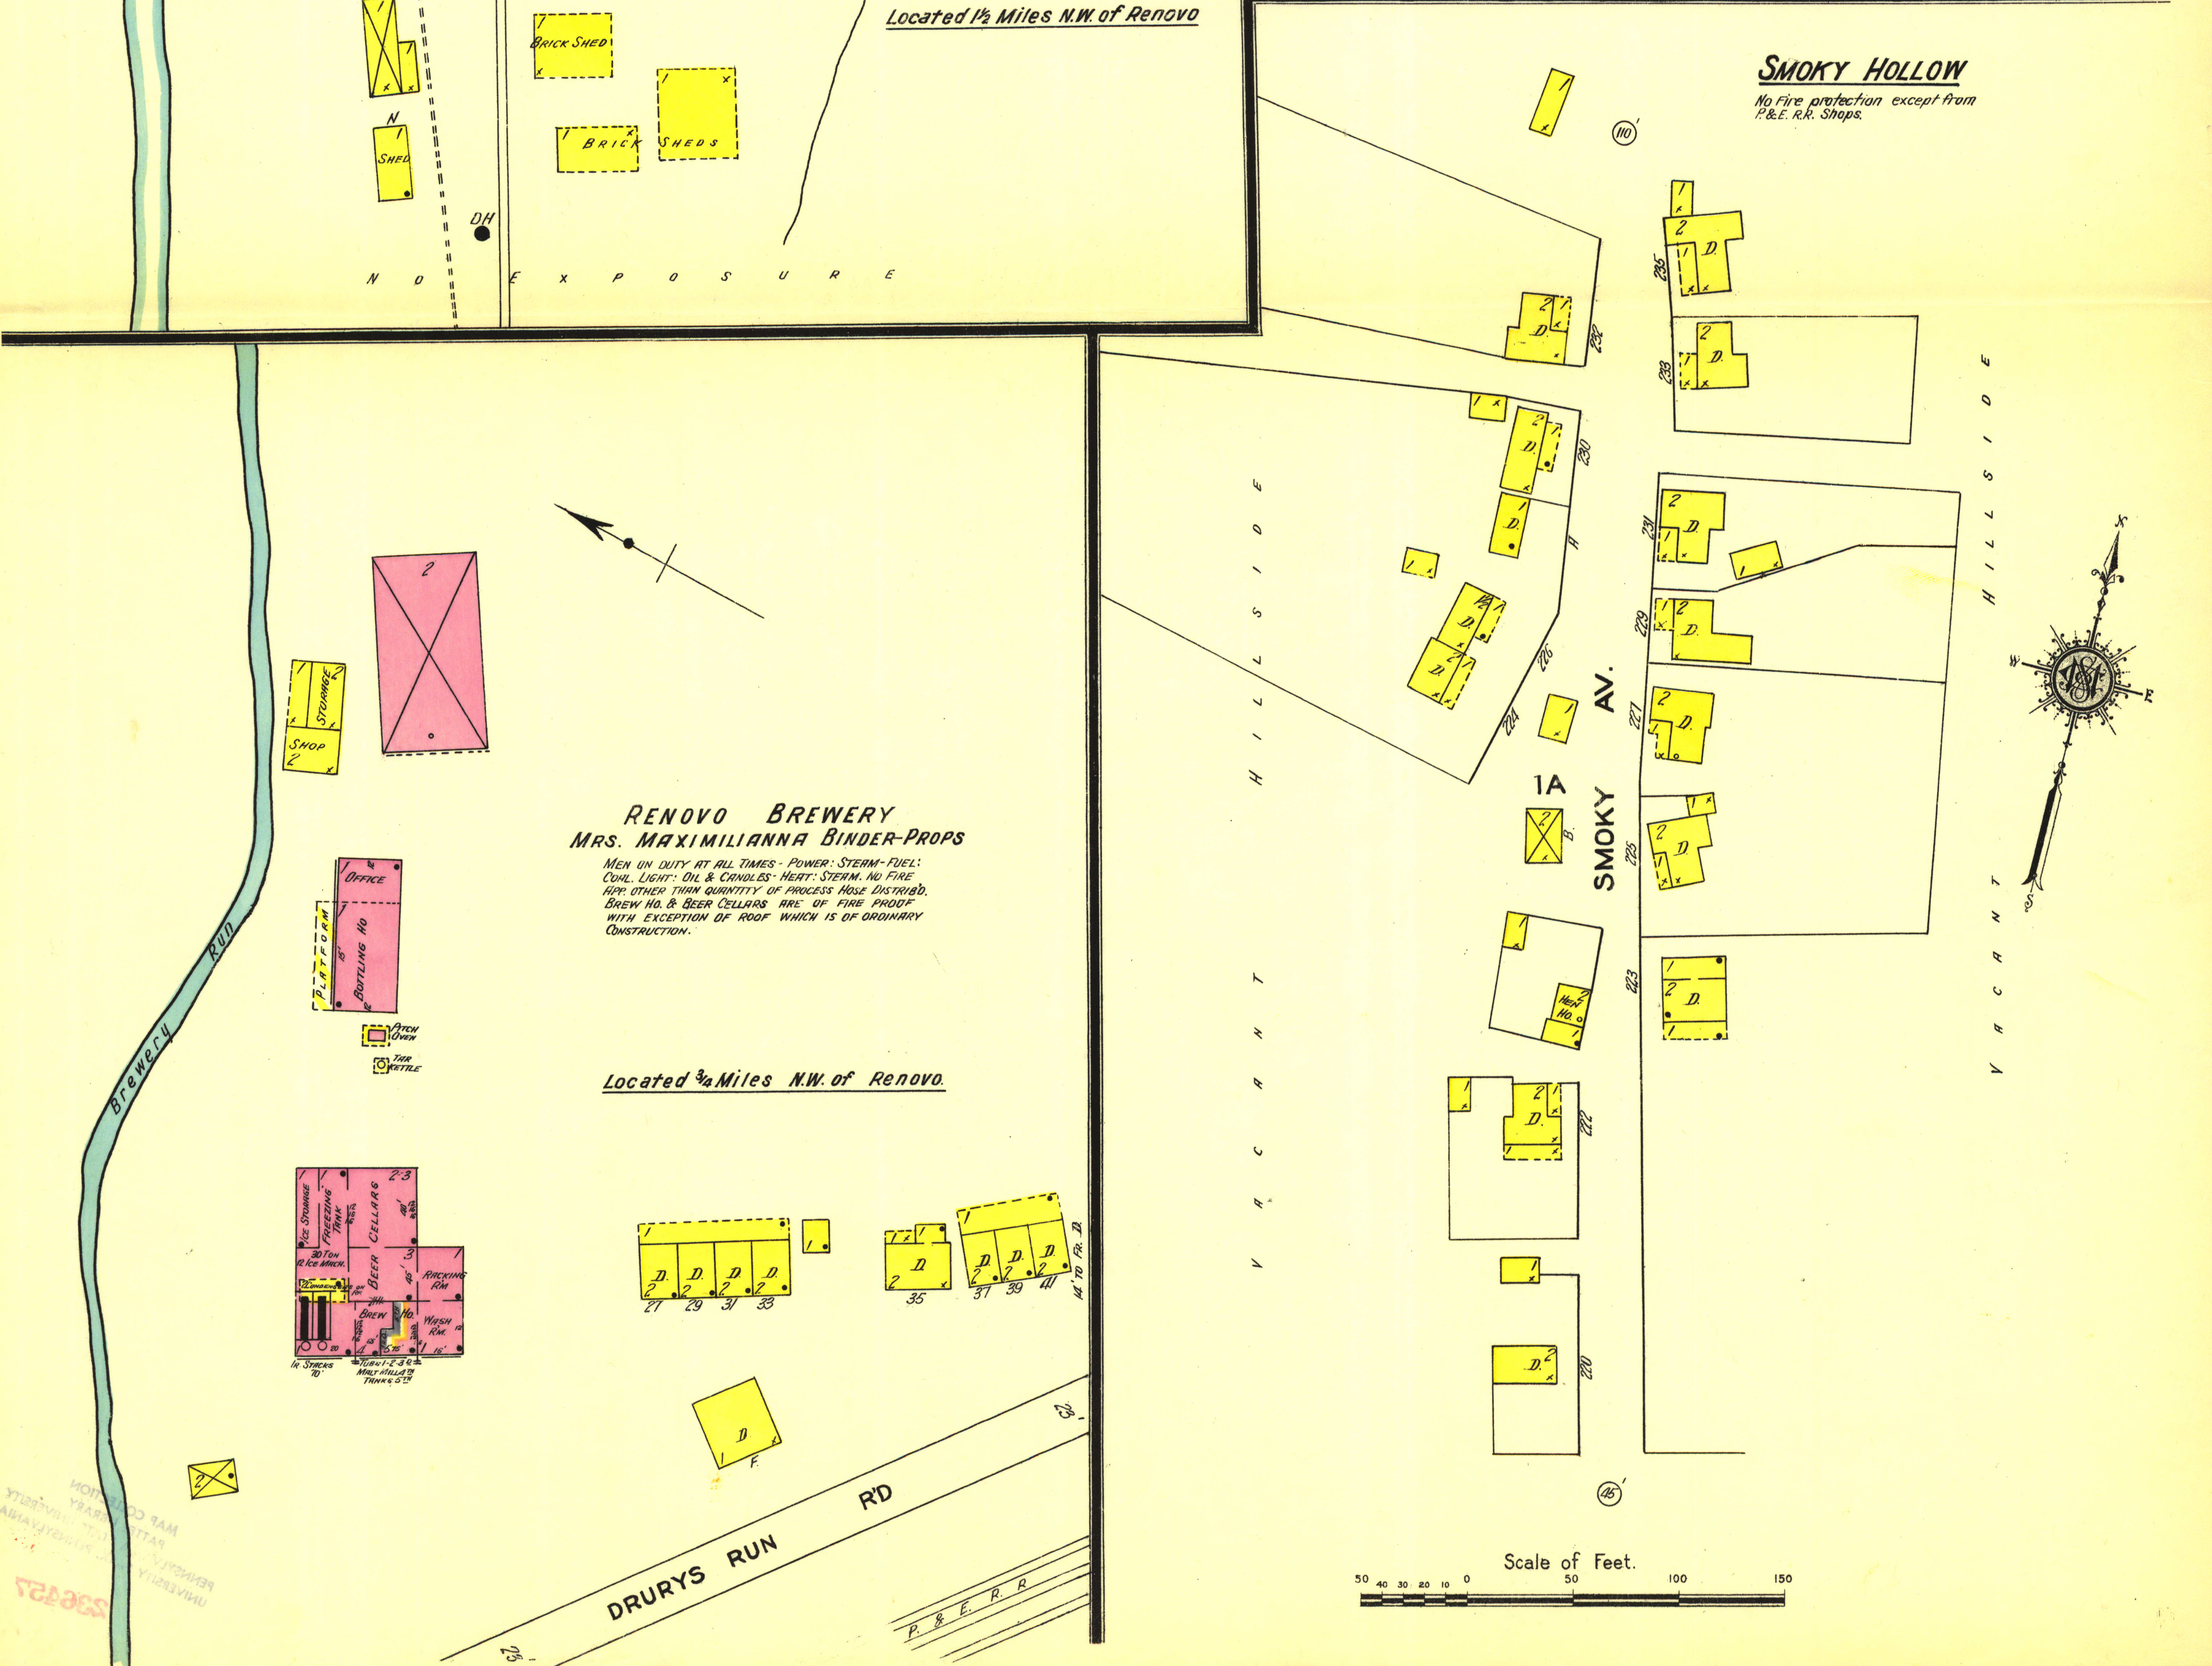
I planned on following this approach for the rest of the map, but ran into a problem when I got to the outskirts of town, specifically to the west. The majority of Austrian-Slovenians and Hungarian-Slovakians lived in an area called Stouts Hill that is not referenced on the 1911 map. Knowing about the geography of the area, I know where this location is and also that the majority of the houses on Stouts Hill were demolished well after 1911 (not sure on exact date but most likely mid-20th century) to make more room for the state highway that currently occupies that space today. There are some dwellings on the Sanborn map (next to Binders Brewery, also an immigrant-owned business) that match up with the house numbers on the census, but then the house numbers continue where there aren’t any mapped locations. Where I think the census records should match up, the house numbers on the map are not the same in the census. It looks like the census enumerator just started counting the houses at some point, as they are numbered sequentially, 1, 2, 3, etc. Another issue is that the area on the map called Smoky Hollow isn’t included in the census records. I think the enumerator visited those houses, but possibly labeled them as being part of Stouts Hill, but I do not know for sure, as the house numbers don’t match up either. Geographically, Smoky Hollow is adjacent to Stouts Hill, so it is plausible. I’m not sure how to map the data to the exact location.
This problem is causing me much frustration and I don’t know how to solve it. Realizing that the census data is from 1910 and the map is from 1911, I expected some wrinkles. One option would be to not include those who I cannot map, but that leaves out a large chunk of immigrant workers that I want to display. My goal is to splice together the different sheets of the Sanborn map to show the entire town, but I can only work with what exists. I really want to show as much detail as possible, but I could attempt to do more generic visualization of immigrant workers in the town, like a heat map.
Another problem I am having is that I wanted to show the changes in the number of immigrant workers over time. I wanted to go back to the 1880 census and map the houses of all the foreign-born workers but the closest Sanborn map I have is from 1887, and I feel like seven years is too wide of a gap to map. Also, these records don’t even include house numbers for me to plot, so I would need to use a different visualization method. If anyone has read through this entire confusing post and has any ideas or suggestions for me, I would be happy to hear them. Hopefully the rest of the class is having an easier time with their final projects!
This week I’ve commented on Kim’s blog post on her SketchUp project.
I feel your pain!
I’ve attempted to do something similar before and very quickly ran into the problem with census data. I’ve looked all over for a key to matching house addresses with census identification and have yet to find one.
The only way to solve the problem is manually, using a city directory from the same year and a “Person Zero” about whom you have sufficient biographical detail to match them to a census list and a known address. It’s important to use a city directory from the same year because immigrant families moved frequently.
Once you have successfully cross-matched them, move to the next-door neighbor and generate the same level of detail. Now you know in which direction the census taker was recording information on that block.
From there, you can move with some confidence down the block. Once you’ve filled in the census data, you should have names, occupation, and (depending on the census year) place of origin — either primary or parental. You can use city directories (which were published annually) to trace subsequent movement of those families to other locations and jobs. There’s a lot of spatial data implied in the results.
Now that you’ve filled in a spreadsheet or database with information on this population set, you need to become familiar with the term “prosopography.” Working on small scale projects like this is part of the reason I ended up in GMU’s applied history program. 🙂
The best you can do is explain what the evidence reveals. If pieces of the evidence are missing or unclear, you can state that too. The evidence isn’t always going to reveal what you want it to. For me that is the most frustrating thing. But gaps in the evidence can be just as problematic. You must remain aware, as you obviously are, that filling in the gaps might change the types of conclusions you draw. But doing the best with what you have is always a good piece of advice. Let the gaps stand and work around them.
Could you just focus on one specific group of immigrants…perhaps one for which you have the data you want?