Category Archives: visualization

Testing Out Network Visualization Tools

This week in class, we looked at a few different data visualization tools, such as RAW and Palladio. After class I attempted to try out the tools on my own, which was kind of fun. I like being able to visualize information in a non-textual format, especially when you can use fun colors like RAW allows you.

Using a dataset provided by Dr. Robertson that connects Civil War units with corresponding battles, I created a visualization with the Alluvial Diagram option. RAW allows you to customize the size and color, which I did by enlarging the height (1500px) and width (500px), and changing the colors to ones I thought looked good to me, but were also distinct, as you can see below.

Aldie 2AldieAtlanta 1AtlantaAverasboro 1AverasboroAylett’s 1Aylett’sBealton Station 1Bealton StationBeaver Dam 1Beaver DamBentonville 1BentonvilleBerryville 1BerryvilleBethesda Church 1Bethesda ChurchBeverly Ford 1Beverly FordBrandy Station 1Brandy StationBrentsville 2BrentsvilleBull Run 4Bull RunCassville 1CassvilleCedar Creek 1Cedar CreekCentreville 1CentrevilleChancellorsville 3ChancellorsvilleCharles City Courthouse 1Charles City CourthouseCharlestown 1CharlestownChattanooga 1ChattanoogaCold Harbor 2Cold HarborCross Keys 2Cross KeysCulpepper Court House 2Culpepper Court HouseDallas 1DallasDeep Bottom 1Deep BottomDinwiddle 1DinwiddleFairfax Courthouse 1Fairfax CourthouseFalling Waters 1Falling WatersFisher’s Hill 1Fisher’s HillFive Forks 1Five ForksFort Scott 1Fort ScottFredericksburg 1FredericksburgFront Royal 2Front RoyalGaines Mill 1Gaines MillGettysburg 4GettysburgGrove Church 1Grove ChurchGroveton 1GrovetonHagerstown 1HagerstownHalltown 1HalltownHanover Court House 1Hanover Court HouseHarrisonburg 1HarrisonburgHartwood Church 1Hartwood ChurchHawes’s Shop 1Hawes’s ShopHope Landing 1Hope LandingJefferson 1JeffersonJones Cross Roads 1Jones Cross RoadsJones’ Bridge 1Jones’ BridgeKelly’s Ford 1Kelly’s FordKenesaw Mountain 1Kenesaw MountainLaurel Hill 1Laurel HillLeetown 1LeetownLiberty Mills 1Liberty MillsLuray 1LurayMalvern Hill 1Malvern HillMiddleburg 2MiddleburgMiddletown 2MiddletownMilford Station 1Milford StationMine Run 1Mine RunMonterey 1MontereyNew Creek Station 1New Creek StationNew Market 1New MarketNorth Anna 1North AnnaOld Church 1Old ChurchOpequon 2OpequonPeach tree Creek 1Peach tree CreekPetersburg 1PetersburgPicket 1PicketPiedmont 1PiedmontPiney Branch Church 1Piney Branch ChurchPoplar Springs 1Poplar SpringsPort Republic 1Port RepublicPrince George Court House 1Prince George Court HouseRacoon Ford 1Racoon FordRapidan 1RapidanRapidan Station 1Rapidan StationRappahanock Station 3Rappahanock StationResaca 1ResacaRichmond 1RichmondRobertson’s River 1Robertson’s RiverRobertson’s Tavern 1Robertson’s TavernRood’s Hill 1Rood’s HillShepherdstown 2ShepherdstownSmithfield 2SmithfieldSnicker’s Gap 1Snicker’s GapStone Mountain 1Stone MountainStrasburg 1StrasburgTodd’s Tavern 1Todd’s TavernTom’s Brook 1Tom’s BrookTotopotomoy 1TotopotomoyTrevilian Station 2Trevilian StationTurner’s Ferry 1Turner’s FerryUpperville 1UppervilleWauhatchie 1WauhatchieWeldon Railroad 1Weldon RailroadWhite House 1White HouseWhite Post 1White PostWilderness 2WildernessWillow Springs 1Willow SpringsWinchester 1WinchesterYellow Tavern 1Yellow TavernYorktown 1Yorktown136th New York Infantry 14136th New York Infantry1st Michigan Cavalry 281st Michigan Cavalry29th New York Infantry 629th New York Infantry44th New York Infantry 2244th New York Infantry4th New York Cavalry 544th New York Cavalry

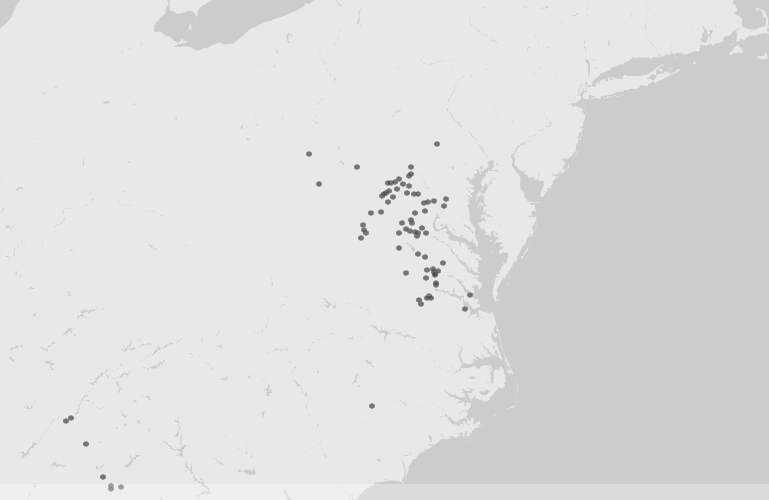
I used the same dataset as above with Palladio, which offers visualization options such as maps, graphs, lists, and galleries. I had some trouble trying to extend the Battles to include their location coordinates, but after reading the FAQ I realized that I needed to identify the new data as “place, coordinates” for it to display properly. I was able to create a moveable graph with the nodes (the units) connecting to the battles, and with the location coordinates I was able to see the battles displayed on a map. Unfortunately there are no embedding options that allow for interactivity, so I’ve taken a screenshot of the map. On the live version, you can click on on hover over each dot to reveal the name of the specific battle.

Palladio screenshot, map view

After playing around with RAW and Palladio, I took a shot at Gephi, which requires a download and installation. Even after re-reading Elena Friot’s tips and personal experience with Gephi, I still didn’t quite grasp its usefulness. I added the data in as described, but all I got were a cluster of dots that I didn’t know what to do with. I much prefer the more user-friendly interfaces of RAW and Palladio, and I’m trying to think of ways to use them in my own research. I could try creating a dataset from the Henry Schweigert diaries that link the diary entries by date to locations in which they were written, or what subjects are mentioned in them, in order to gain a different perspective of the overall patterns in the diaries.