No, not maps of where naked people ride the metro! I just came across this quiz of identifying cities based on their subway maps drawn to the same scale, with all other landmarks hidden. I took the quiz, because I’m a sucker for map quizzes, and even though I’ve been to a few of the cities featured I passed with a 9 out of 11 correct! If you have time, take the quiz. I mostly guessed on all but a few of them.
These maps are pretty bare bones but they do reflect the geography of their cities. For instance, I guessed correctly on the Chicago map because it looks like it was following the shoreline of Lake Michigan. The New York one kind of looked like it focused more subway lines in the Manhattan area. The funniest one was the Glasgow map, since it was basically just a circle. I totally guessed on that one by the way.
These maps don’t really help with my project directly, but it does have me thinking about how I will want to display the Pennsylvania Railroad lines and if I will want to keep the details of towns/names to help readers identify the area. I think for my project, I will want a happy medium between too much and too little information.
This week, I’ve been working on trying to solve my problem of displaying demographic info geographically, when the geographic information isn’t precise. I still haven’t solved that problem, but I’ve played around with different methods of presentation. I’ve also started to recreate a map that I would like to use in my project with Illustrator.
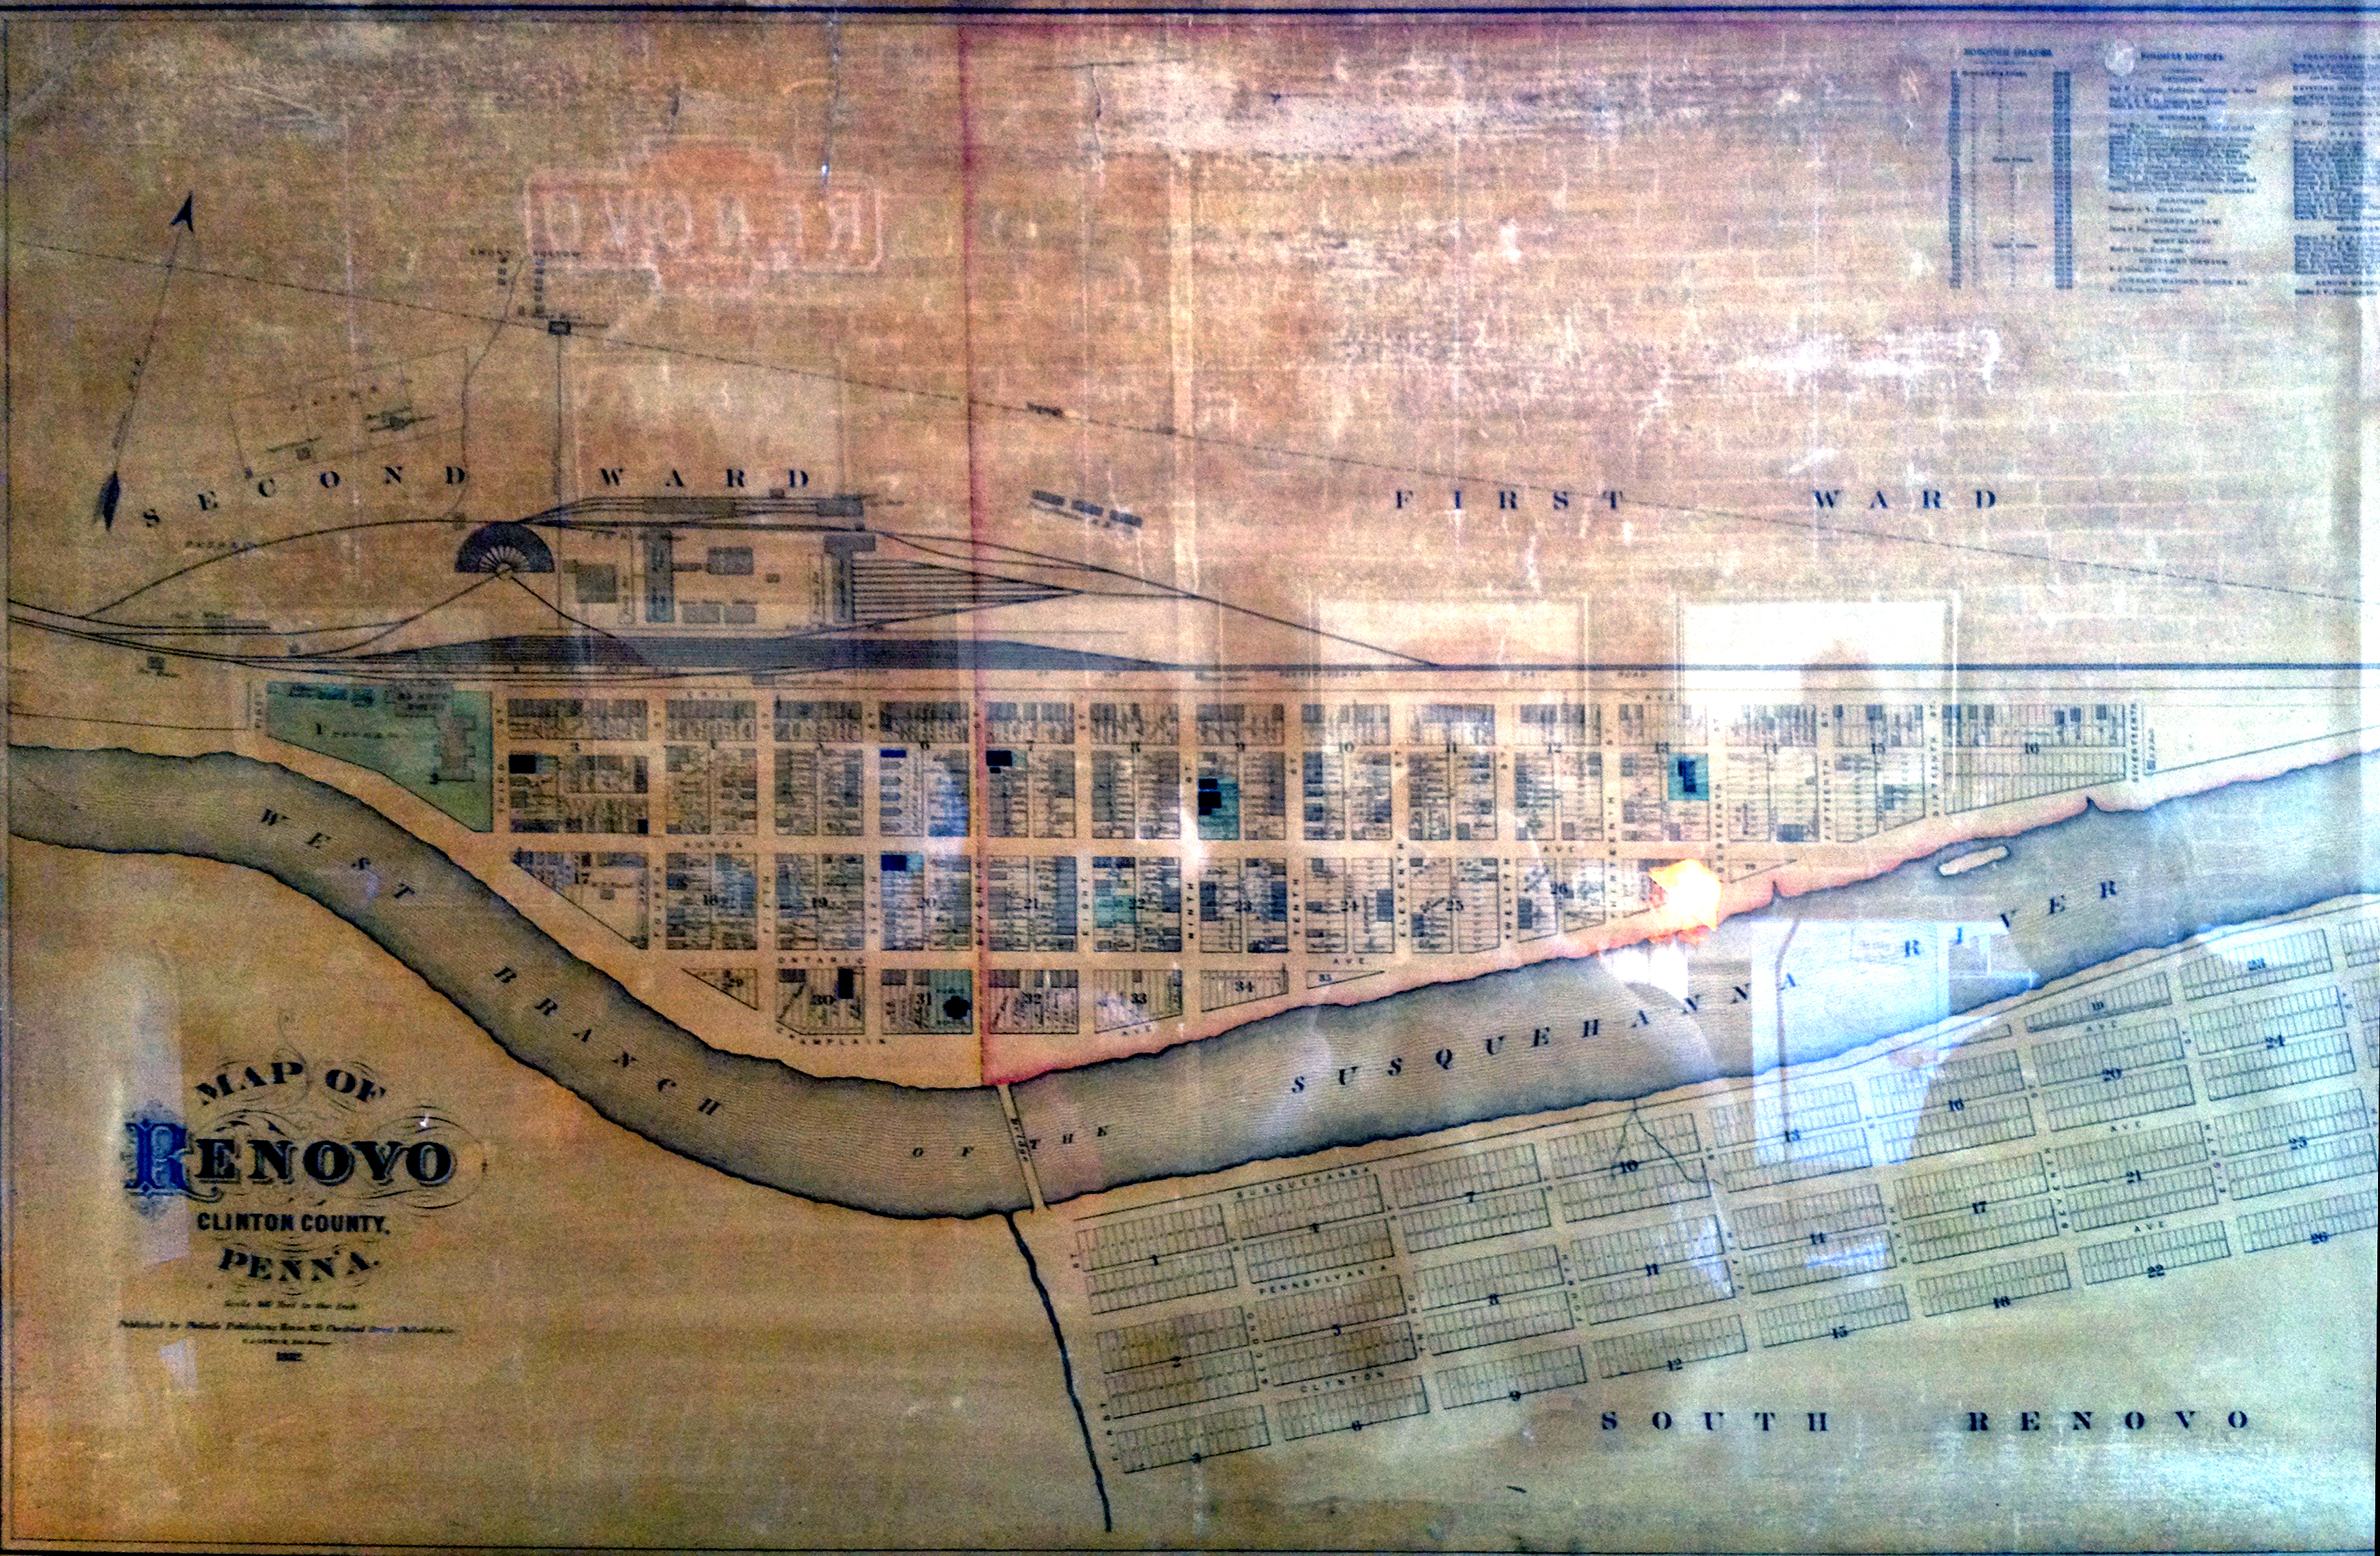
When I visited Renovo in October, I took a photo of a map from 1882 that was framed behind glass on a wall inside the Greater Renovo Area Heritage Park Association’s headquarters. That picture, as you can see below, wasn’t that great, no matter how much Photoshopping I tried.
1882 Map of Renovo with rail yard
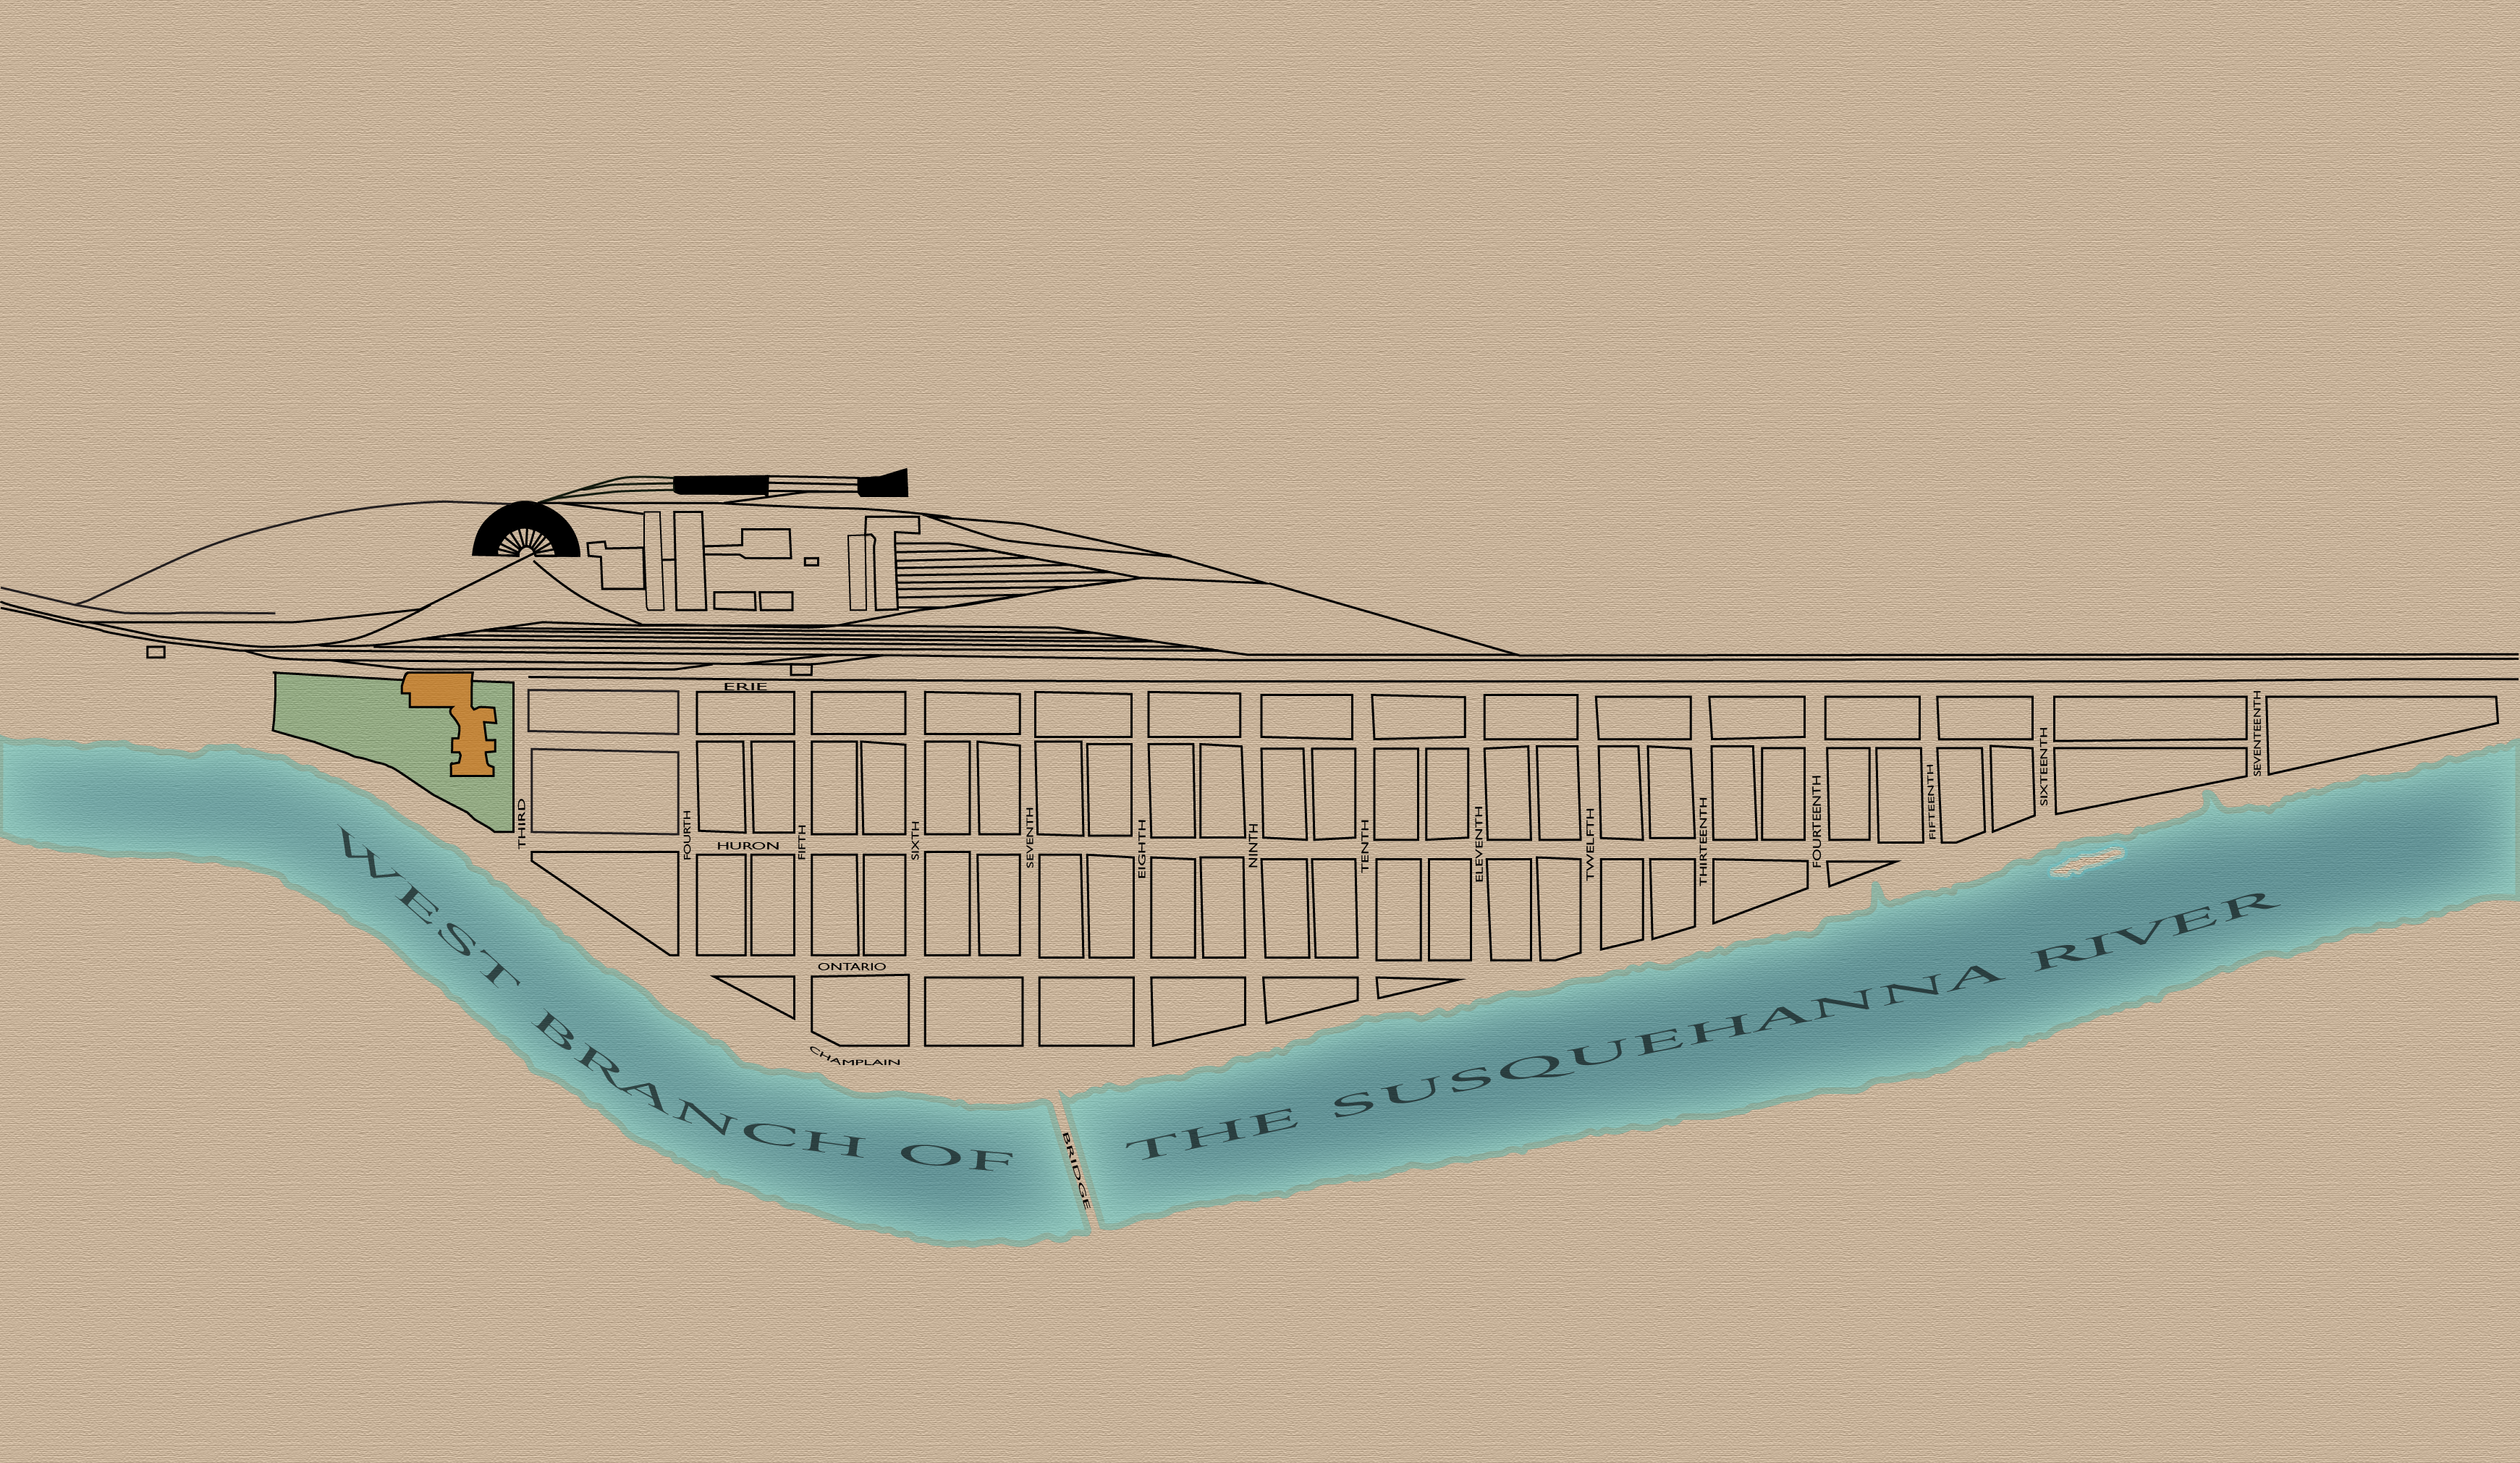
I decided to throw it into Illustrator and start tracing the outlines of the blocks and rail yard, and came up with this image (still unfinished):
Digitally enhanced map of Renovo, PA, 1882
I colored in the river and applied the inner glow filter to it, as well as placed the tracing on top of a texturized beige background. I tried to replicate the lettering of the streets to match the original, but I might need to go back and touch those up, especially the text on the river. I colored in the grassy lot and combination passenger station and hotel in the upper left corner, just to see how it would look. I’m not quite sure what to do with the rest of the blocks yet, as the detail from the original map is difficult to interpret. I think this version looks much more clean and legible than the original, and I hope I will be able to used this in my final project somehow, even if just to provide an overview of the layout of the town. I also didn’t include South Renovo, as the lots on the original were just placeholders for future development. I may use that space to include a legend of the map.
The other aspect of my project that I’m still wrestling with is the geographic presentation of immigrant distribution throughout the town. While I have house-level detail of address for the 1910 census, the 1880 census only gives me basic information, such as whether they lived in the East or West Wards of the town. In the 1880 census, the wards were divided at 7th Street, so at least I have that information to work with. Since I have entered all the immigrants’ current locations based off the census into a spreadsheet, I tried putting that data into one of the tools I learned about last year in Clio 1. The tool is called RAW, and can help display data tables visually. Since I only had tables of addresses that only contained “East Ward” or “West Ward” and place of birth with countries’ names, I didn’t have any numbers to work with. This limited my options a bit, but I was able to create two different charts to display the demographic distribution.
This first one is an Alluvial Diagram that connects current location with place of birth:
Alluvial Diagram created with RAW
I can’t figure out why Canada and Germany are listed twice, however, which throws off this whole chart. I’ve checked for typos and weird spacings and haven’t found the culprit, so I’ll have to investigate further if I decide to use this in my final project.
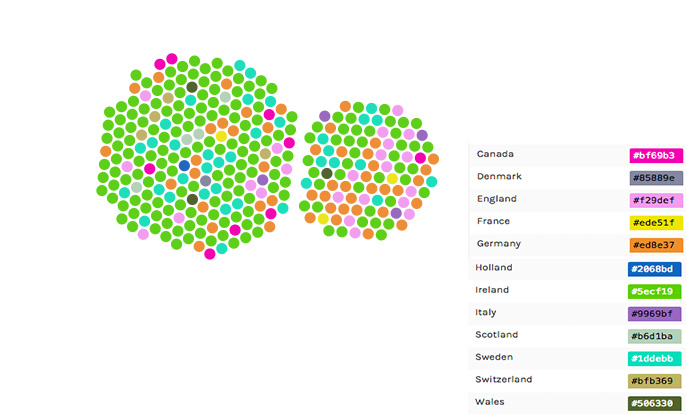
This second map uses clusters to illustrate the breakdown of home countries by ward. Canada and Germany were still listed twice, but I was at least able to alter their color codings to have them match up. I still don’t know why it’s doing that, but at least this map is colorful! I’m assuming the larger cluster is the East Ward because that had a larger number of immigrants (and was bigger geographically), but the cluster map doesn’t label it. I Photoshopped in the legend because without it, this just looks like a bunch of pretty dots.
Cluster map made with RAW
Both of these maps were created for web display, but RAW allows users to download both the .svg and .png formats in addition to the code to embed on a website. I’m not sure how helpful either of these maps are, but they do illustrate that there was a majority of Irish immigrants in Renovo during the 1880 census, and they resided in the East Ward. The German immigrants were heavily distributed in the West Ward and numbered a little less than the Irish. Even if I don’t use either of these maps in my final project, I think they have given me alternative ideas to display the limited geographic information that I have for the 1880 census.
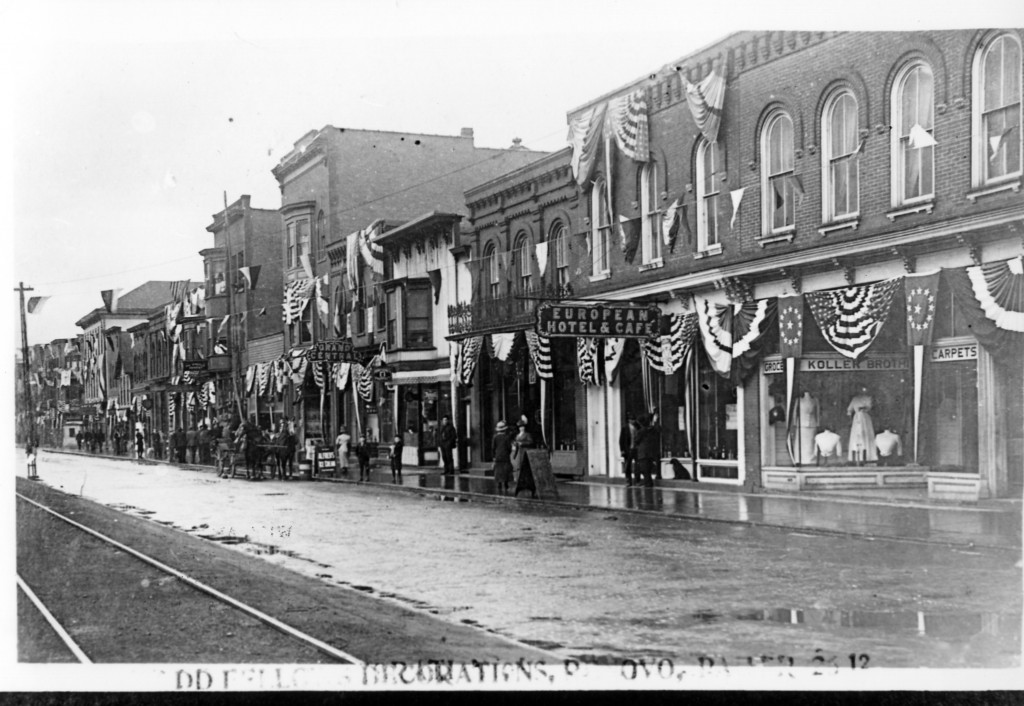
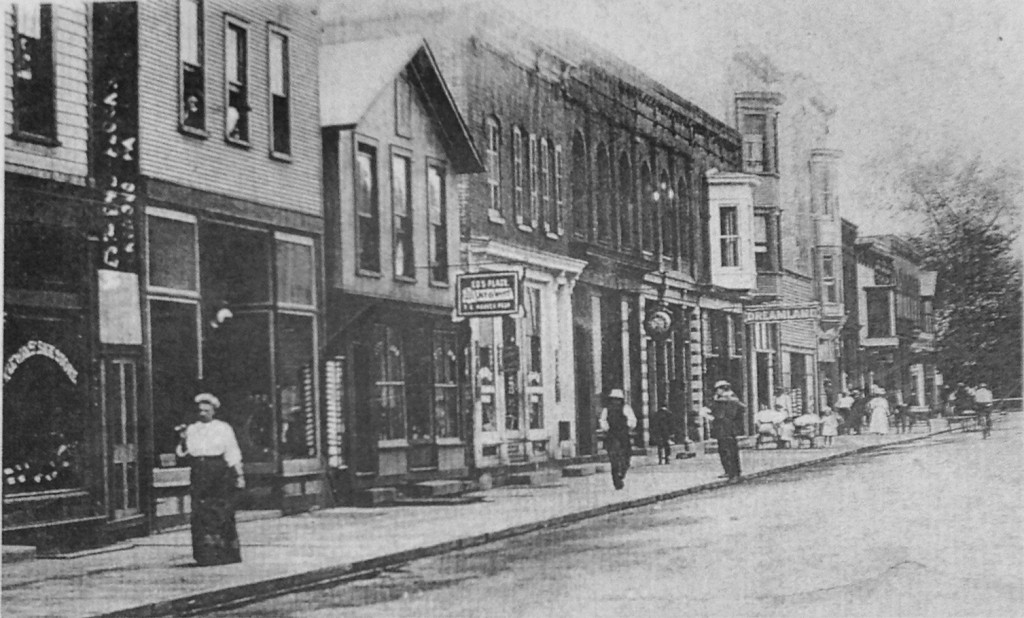
For this assignment, I went back to the 1911 Sanborn map of Renovo, PA and focused my SketchUp project on 3rd – 4th Streets of Erie Avenue. This block would be the first block visitors would see as they exited the railroad passenger station directly across 3rd Street to the west. I used a few photos that I had collected from friends and online sources to reference my SketchUp creation. I tried to be as detailed as possible, especially with the building at 312 Erie Ave, which was the location of Binder’s Hotel in 1911.
View from 3rd and Erie Ave facing east, circa 1910
View looking west from 4th Street on Erie Ave, circa 1906
I have written in an earlier post about the Binder family, who emigrated to the U.S. from Germany in 1852. At least two of the sons, Luke (who was born in Germany) and Adolph (born in Pennsylvania three years after the family’s migration) settled in Renovo as adults to capitalize on the booming railroad industry. Luke purchased and operated a brewery until his death in 1898, as well as bought the building at 312 Erie Avenue in 1887. The building was originally built in 1872 by George Burger, the same man who sold Luke the brewery the same year. It was built as a hotel that could accommodate twenty guests and included a bar and restaurant as well. After Luke Binder purchased the hotel for $8000, he leased it for two years before his brother Adolph took over as proprietor, and opened the business under the name Binder House after making many renovations and improvements. By 1893, Luke, still the owner, built an addition to the hotel that would extend from Erie Ave. to St. Clair Ave. The hotel would stay in the Binder family until at least 1925.
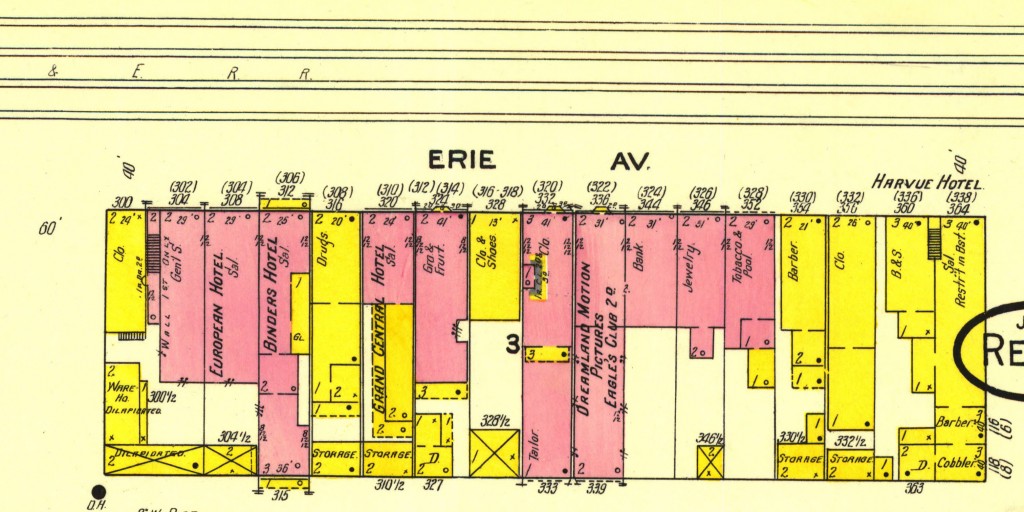
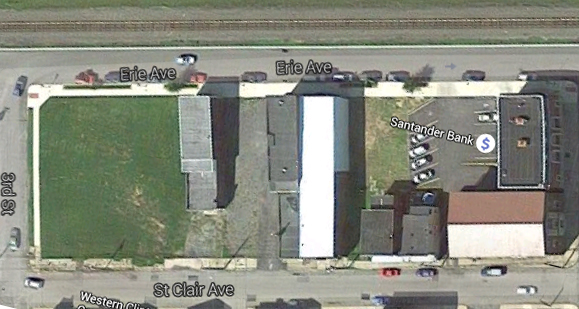
The building no longer stands, as most of this block has either burned down or fell into disrepair over the years. After the railroad closed the repair shops across Erie Avenue in the mid-20th century, the population dropped and businesses closed up shop. Compared with the 1911 Sanborn map, the modern day Google Earth View of the block looks sparse. I wanted to use SketchUp to recreate some of the buildings that have disappeared and to show the contrast in the density of the block.
1911 3rd-4th Street block of Erie Ave, from Sanborn map
Google Satellite view of same block
I was unable to finish the entire block in time to post this, which I regret, as those buildings have been replaced with a large brick bank and parking lot. There are lots of other features that I would have liked to include as well, such as people and trees to make the street look more bustling. I should have included the railroad tracks on the opposite side of Erie Ave, but the resulting views replicate what rail passengers would view upon entering the town. I really enjoyed working with SketchUp and will attempt to continue to work on finishing the block for my final project. I tried to follow the Sanborn map descriptions as much as possible, while also using photographs from the early 1900s. I used red brick for the street as that was the type of material used before it was covered with asphalt.
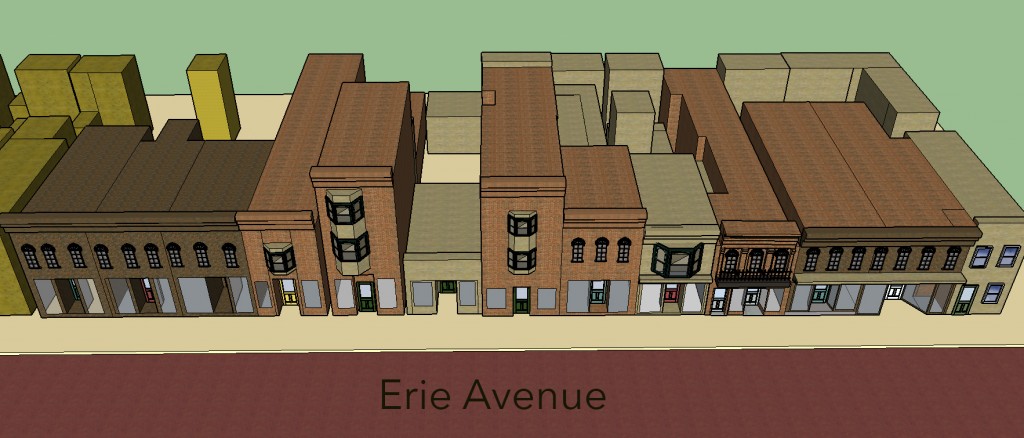
I took a few screenshots of the SketchUp that you can view below:
Erie Avenue from above
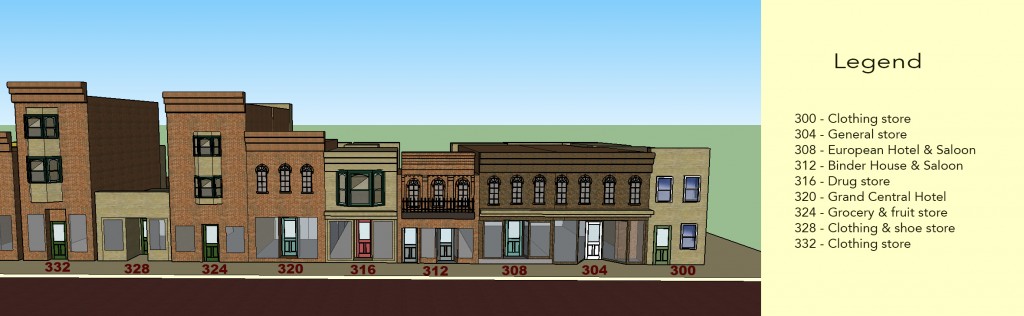
Erie Avenue with Legend
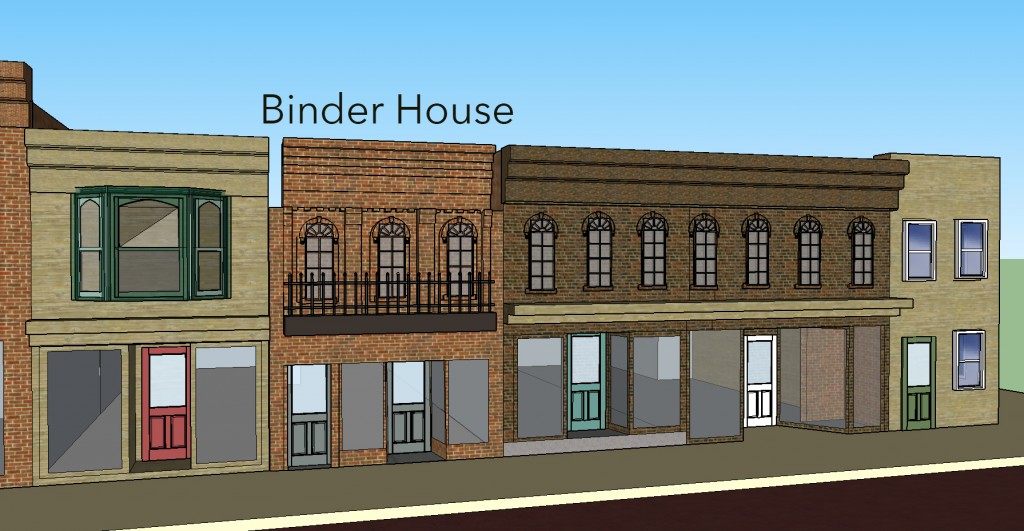
Binder House
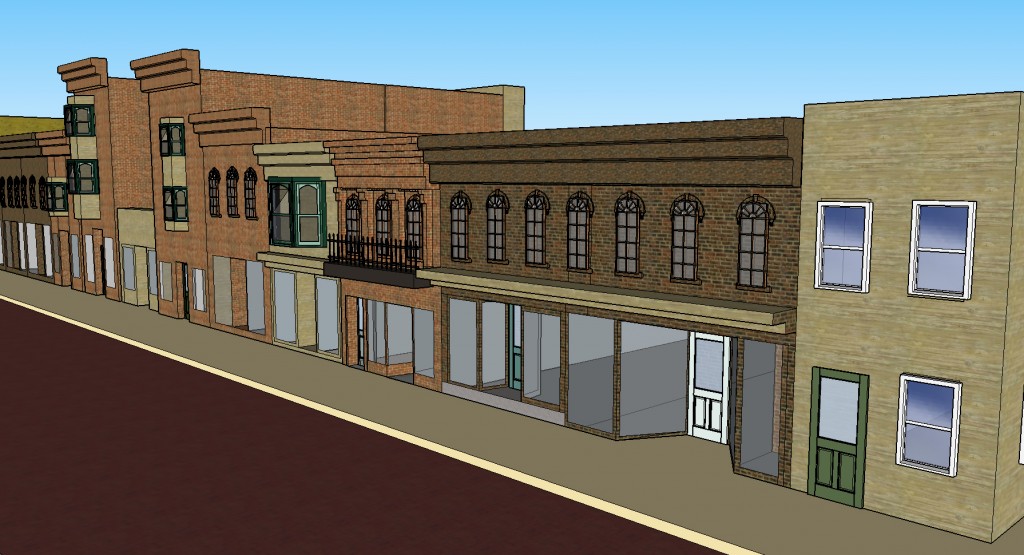
Looking east from 3rd & 4th
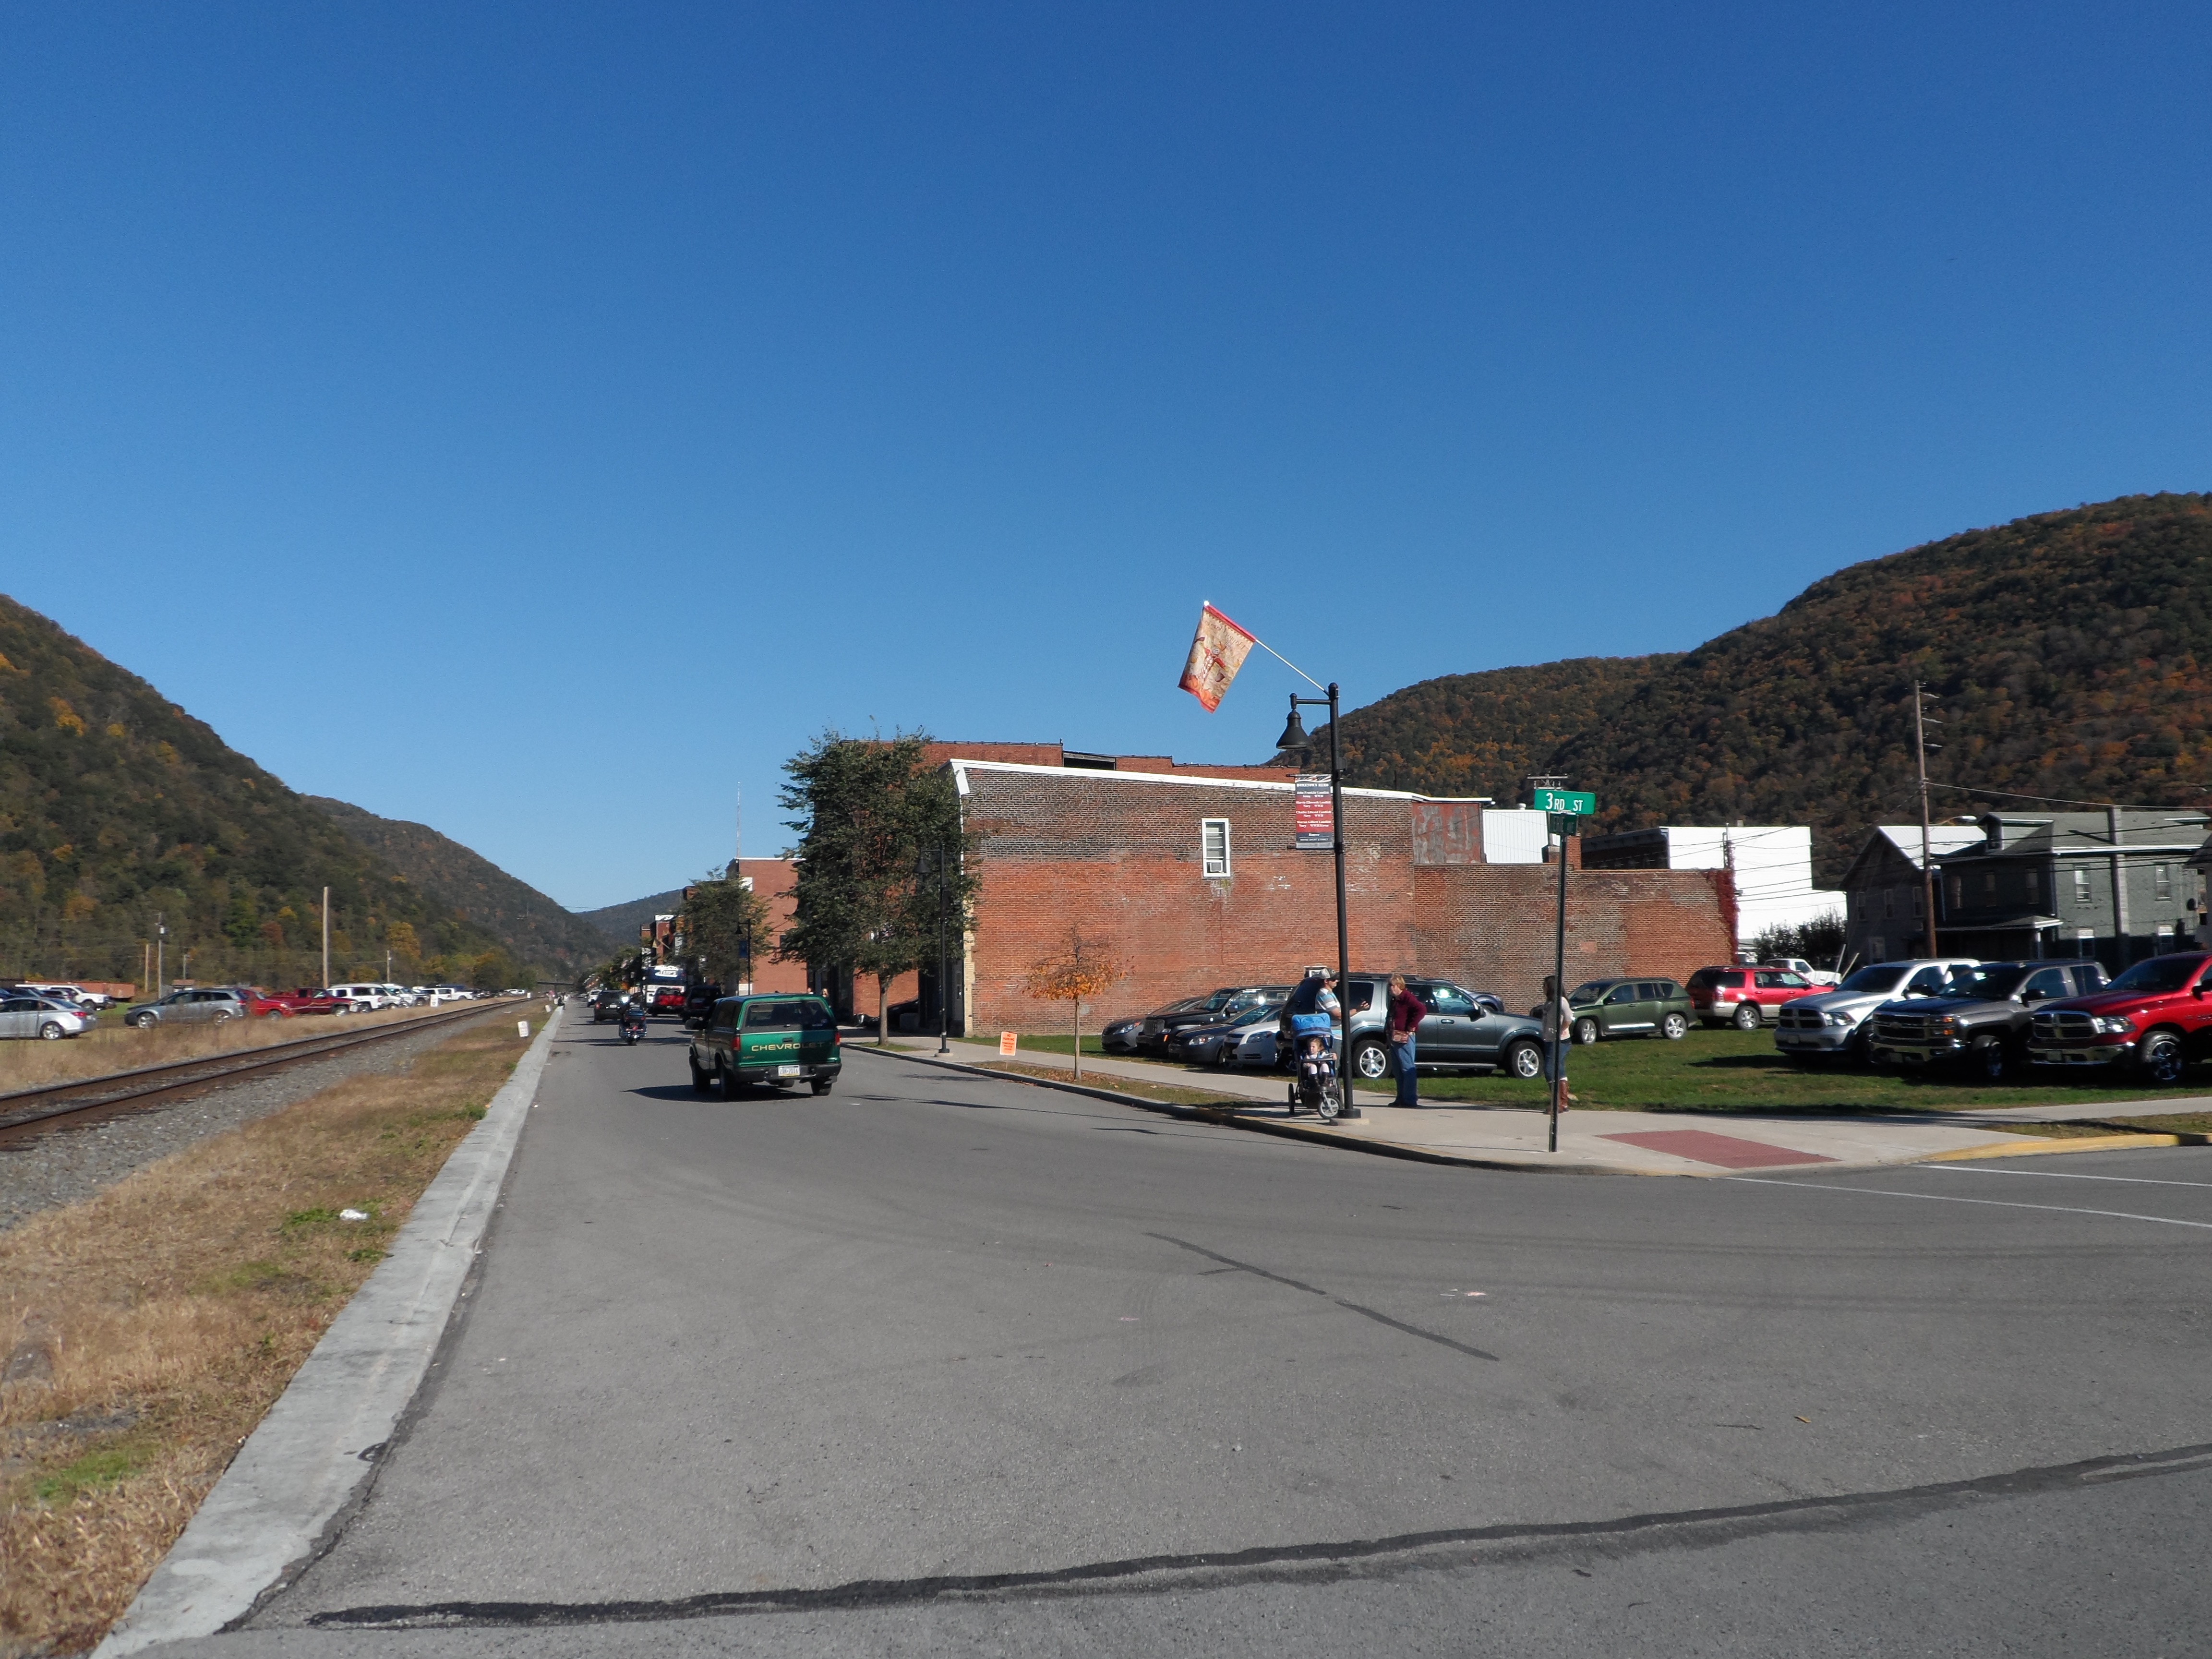
This final image is a photograph I took in October after the annual Flaming Foliage parade, which explains the cars parked in the grass and behind the railroad tracks. You can see the current street view of the same area in the picture, as well as my mom, sister, brother-in-law and my nieces waiting patiently for me to get the photo. The first building on the street is 320 Erie Ave, as the first five structures have been demolished over the years, including the old Binder House.
Current view of Erie Ave from the corner of 3rd Street and Erie Ave.
References:
Short, Wayne E. The History of Renovo, Pennsylvania (1866-1925). Vol. 1. Lock Haven, PA: Reese’s Print Shop, 2003.
This week, I’ve left comments on Josh’s and Jefferson’s blog posts on their SketchUp projects.
Over the weekend, I had a wonderful idea about my final project! But then I hit a wall. I was going to look at the 1910 census records for all three of Renovo’s districts (East, Middle, & West Wards), extract the locations of all of the immigrant workers in the town, then plot those locations on the 1911 Sanborn map to visualize any patterns that might have been occurring at the time. Sounds easy enough, right? Well after I printed all 100+ pages of census data (at least Renovo’s a small town!), I grabbed seven different colored highlighters to color code anyone who was listed as being born in a foreign country. This part was fun! I kept notes on where they worked and where they were born, and unsurprisingly, most immigrants worked for the railroad. In 1911, I counted a total of 185 immigrant workers in the town, with 143 of them working in some capacity for the railroad.
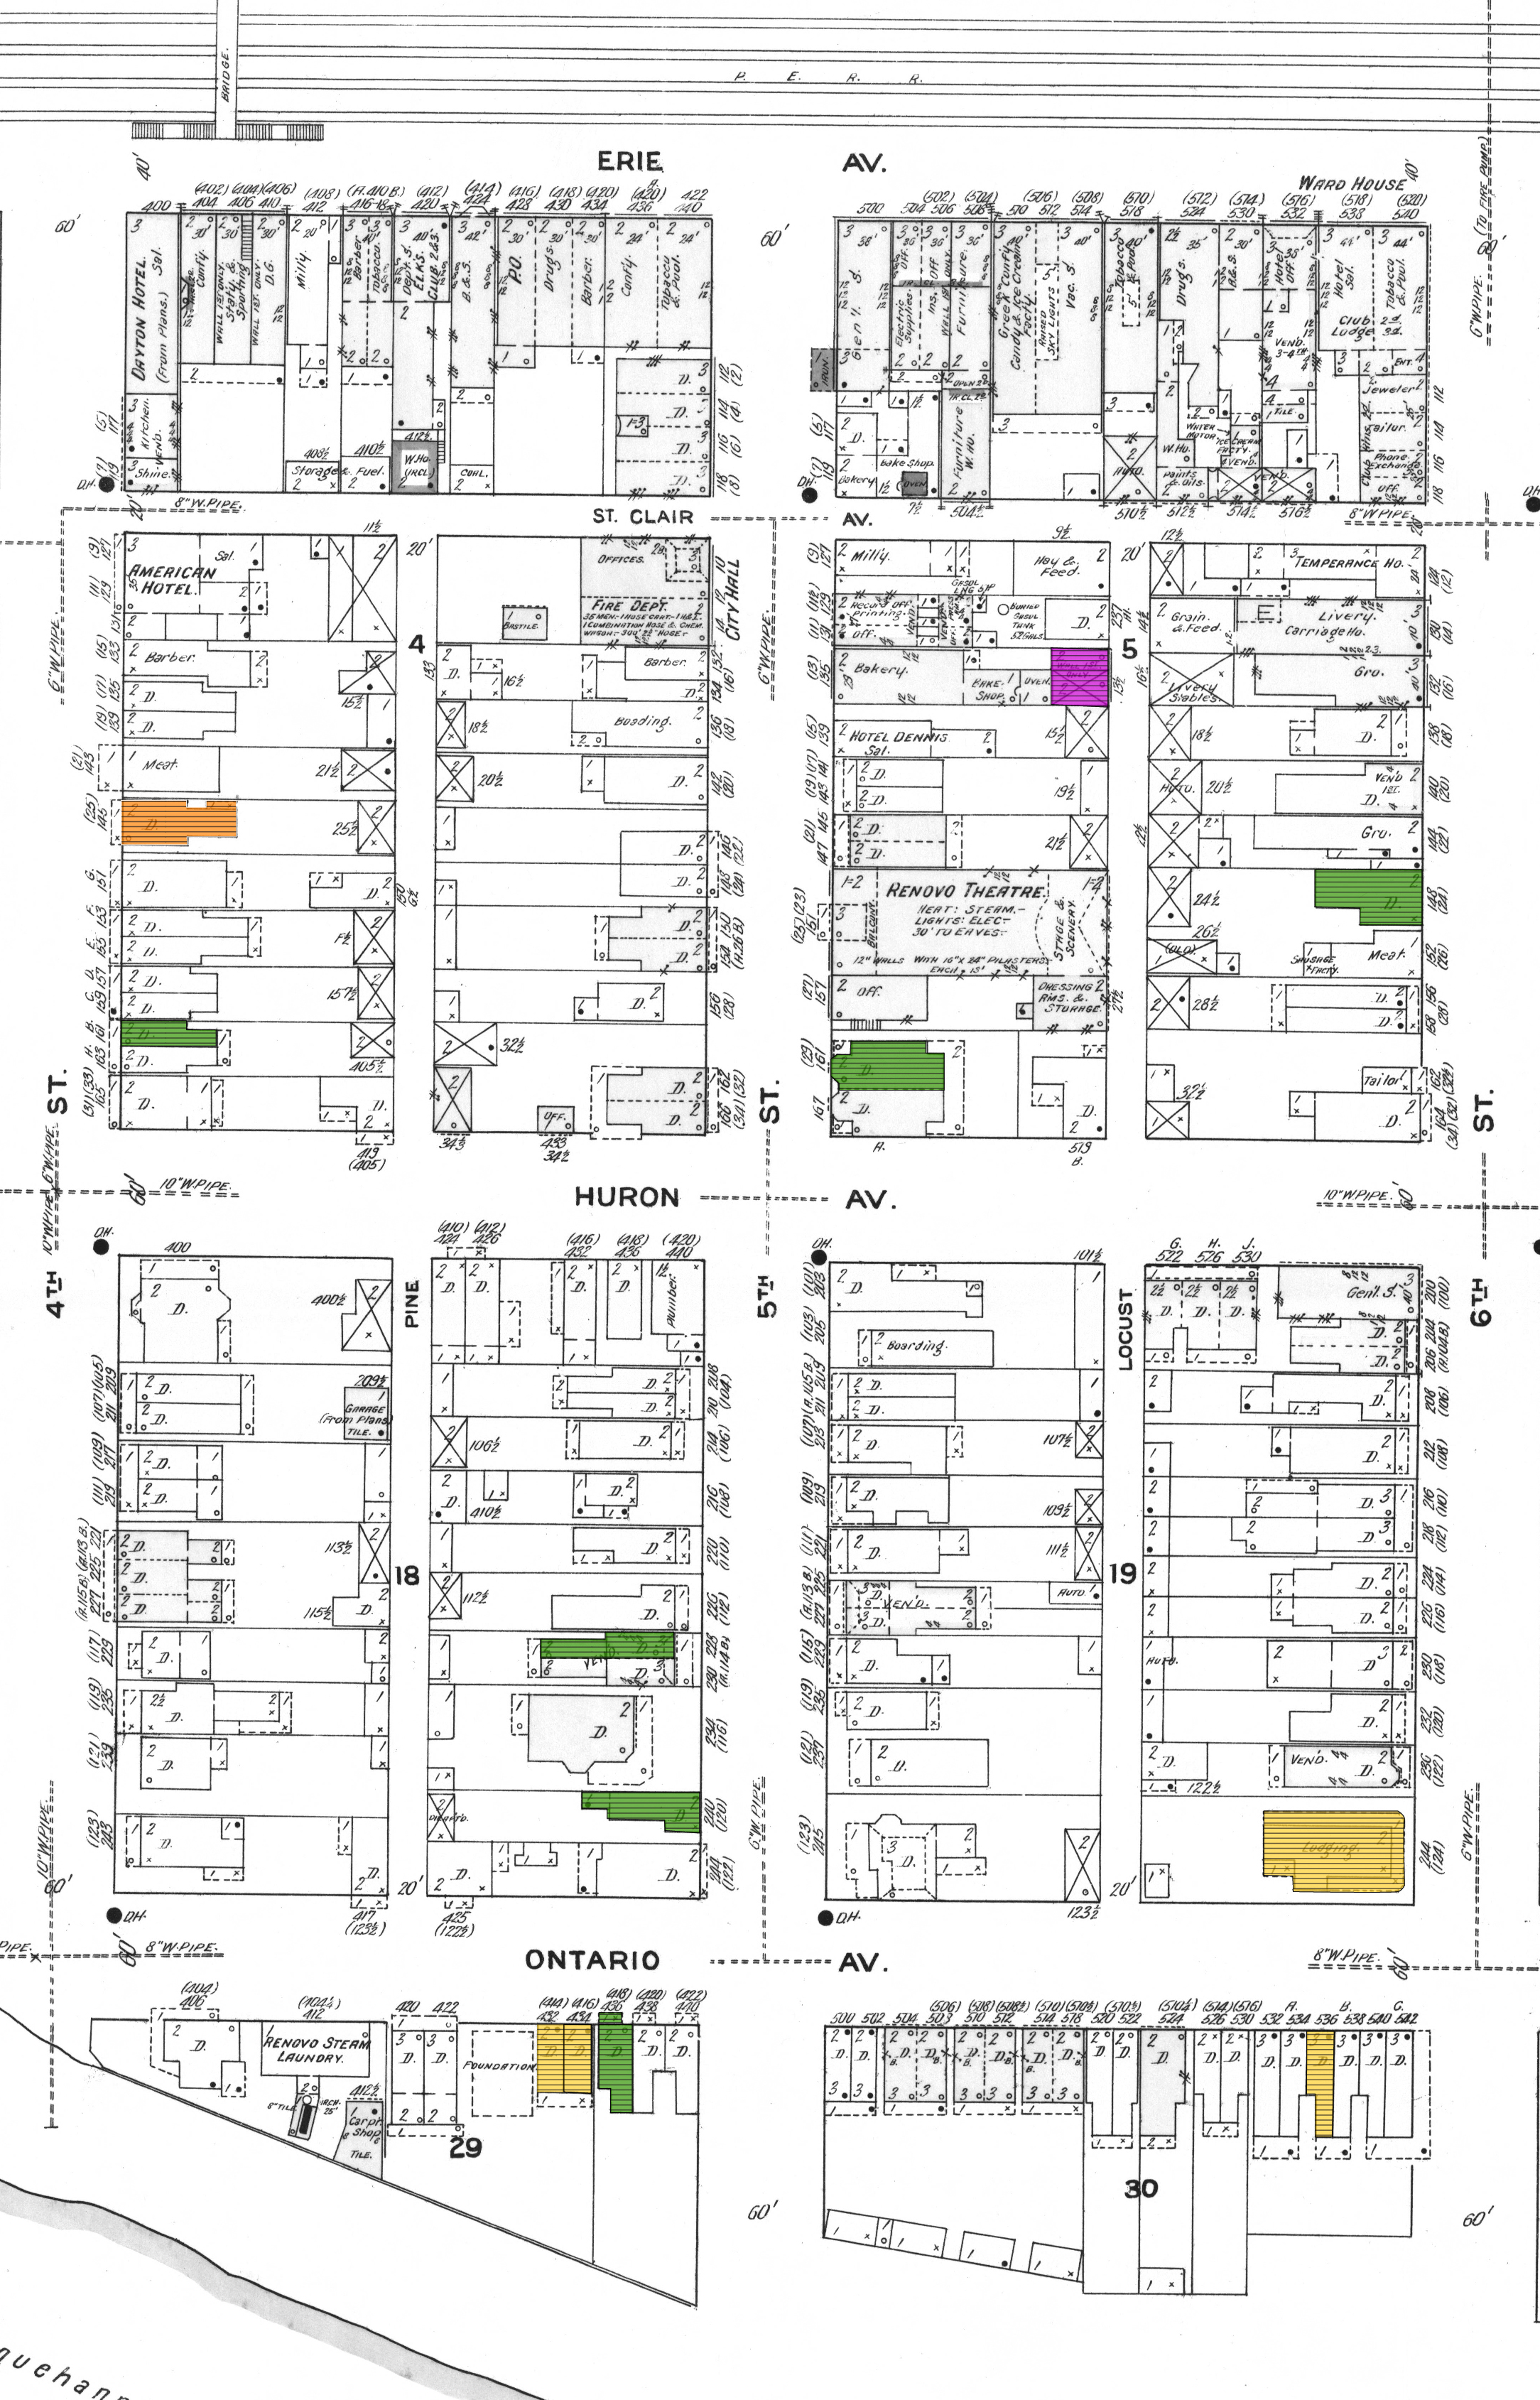
From there I went through the highlighted list of immigrant railroad workers and began plotting them on the 1911 map in Illustrator, trying to keep my color-coded system going. I used yellow for Swedish, orange for German, green for Irish, purple for Italian, dark blue for Hungarian-Slovakian, and light blue for Austrian-Slovenian, just to name the most frequent nationalities. Below you can see one section of the map that I am still working on, a part of the West Ward, 4th-6th Streets. I’ve only included railroad workers here, but plan on adding all immigrant workers.
Railroad workers in Renovo born outside the U.S. based on 1910 census
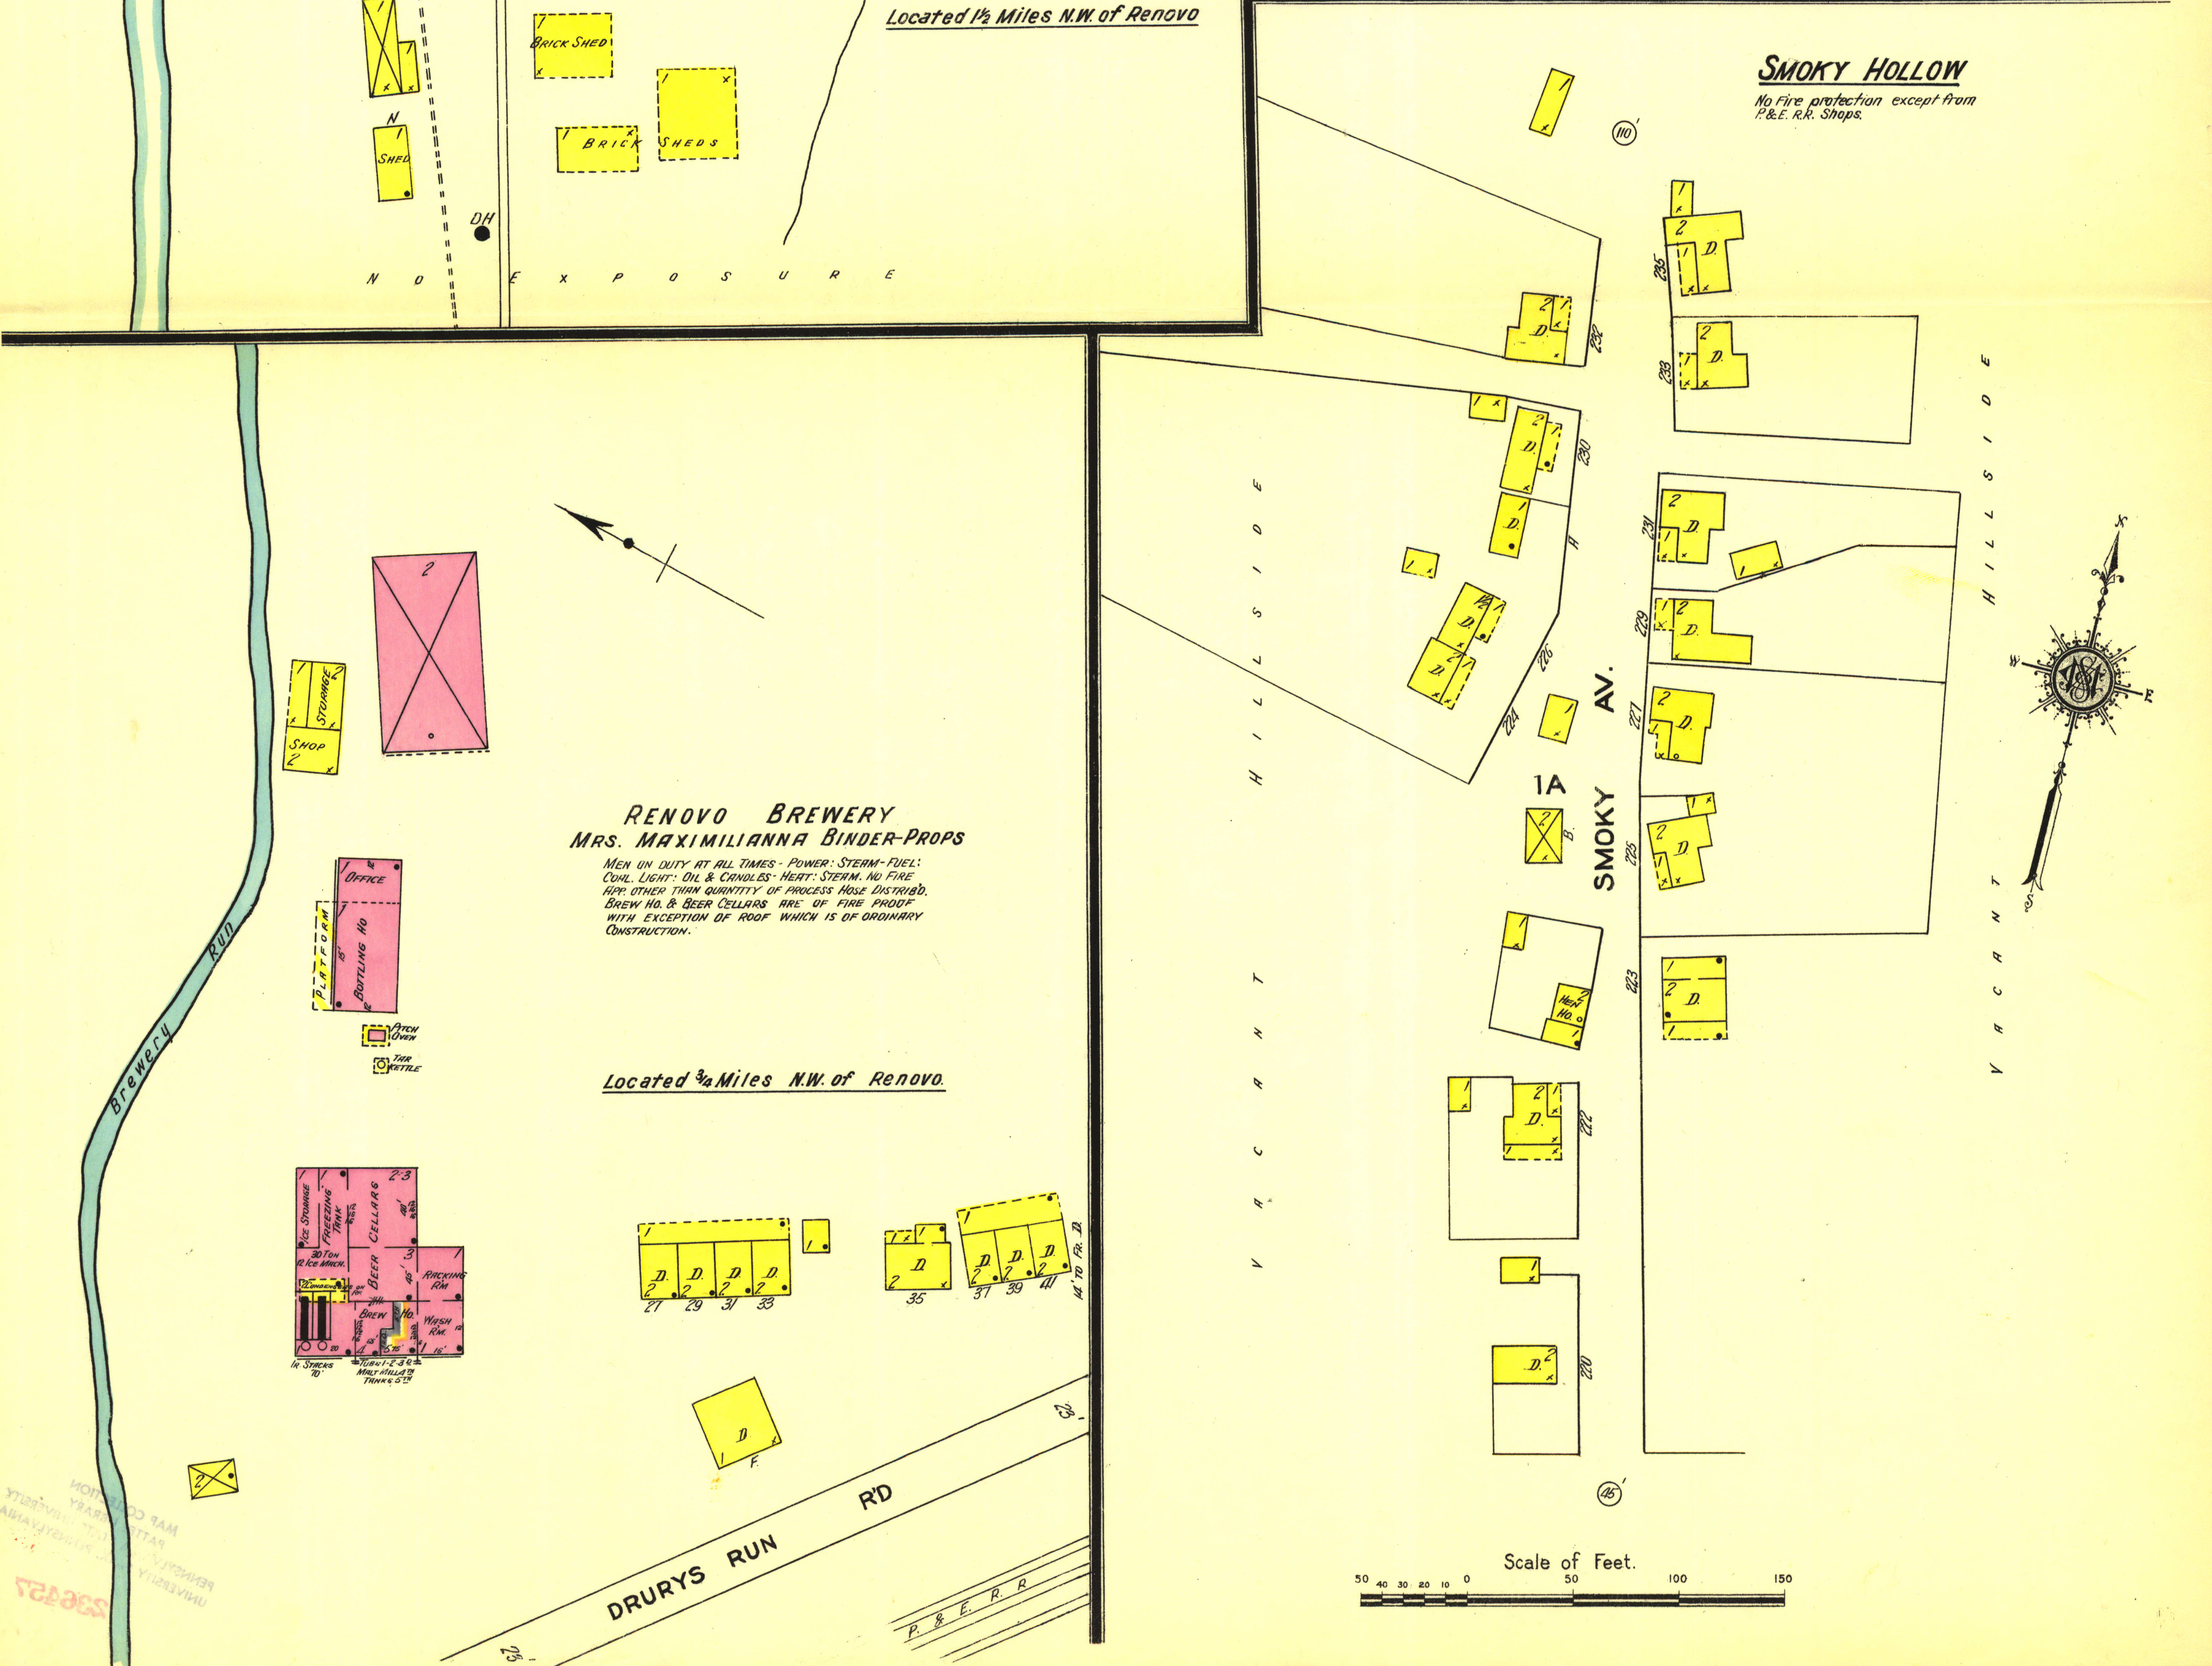
I planned on following this approach for the rest of the map, but ran into a problem when I got to the outskirts of town, specifically to the west. The majority of Austrian-Slovenians and Hungarian-Slovakians lived in an area called Stouts Hill that is not referenced on the 1911 map. Knowing about the geography of the area, I know where this location is and also that the majority of the houses on Stouts Hill were demolished well after 1911 (not sure on exact date but most likely mid-20th century) to make more room for the state highway that currently occupies that space today. There are some dwellings on the Sanborn map (next to Binders Brewery, also an immigrant-owned business) that match up with the house numbers on the census, but then the house numbers continue where there aren’t any mapped locations. Where I think the census records should match up, the house numbers on the map are not the same in the census. It looks like the census enumerator just started counting the houses at some point, as they are numbered sequentially, 1, 2, 3, etc. Another issue is that the area on the map called Smoky Hollow isn’t included in the census records. I think the enumerator visited those houses, but possibly labeled them as being part of Stouts Hill, but I do not know for sure, as the house numbers don’t match up either. Geographically, Smoky Hollow is adjacent to Stouts Hill, so it is plausible. I’m not sure how to map the data to the exact location.
Possibly Stouts Hill and Smoky Hollow, 1911 Sanborn map
This problem is causing me much frustration and I don’t know how to solve it. Realizing that the census data is from 1910 and the map is from 1911, I expected some wrinkles. One option would be to not include those who I cannot map, but that leaves out a large chunk of immigrant workers that I want to display. My goal is to splice together the different sheets of the Sanborn map to show the entire town, but I can only work with what exists. I really want to show as much detail as possible, but I could attempt to do more generic visualization of immigrant workers in the town, like a heat map.
Another problem I am having is that I wanted to show the changes in the number of immigrant workers over time. I wanted to go back to the 1880 census and map the houses of all the foreign-born workers but the closest Sanborn map I have is from 1887, and I feel like seven years is too wide of a gap to map. Also, these records don’t even include house numbers for me to plot, so I would need to use a different visualization method. If anyone has read through this entire confusing post and has any ideas or suggestions for me, I would be happy to hear them. Hopefully the rest of the class is having an easier time with their final projects!
This week I’ve commented on Kim’s blog post on her SketchUp project.
This past week I’ve been playing with SketchUp, after learning how to use it during last week’s class. In class, we worked on recreating a block of Cheyenne, Wyoming using a 1912 Sanborn map from the Library of Congress. SketchUp’s fairly easy to use once you get a hang of how the tools operate, but I feel like there is so much more that the software can do that I haven’t explored yet.
I definitely want to include a 3D version of a Sanborn map in my final project, in order to visualize how the busy street of Erie Ave. in Renovo appeared in 1911, so I did some practice over the weekend with the map I had. I just focused on one block (3rd-4th Streets) and managed to get half of the block outlined and painted with either wood or brick paints. I’ll have to try to use old photographs to help with the details of the buildings, as Sanborn maps only have the outline of buildings, as well as how many stories tall they were, and their building material. I didn’t want to do too much to the Renovo map, as I am hoping we learn more tonight in class.
It would be great to learn more about using Natural Scene Designer as well, as I think using that software to recreate the topography of Renovo in addition to using SketchUp would make the final image more life like. I’m thinking I could use Photoshop to mesh the street view with the topographic view, as Renovo’s mountains are equally important as its streets.